Stress–strain curve
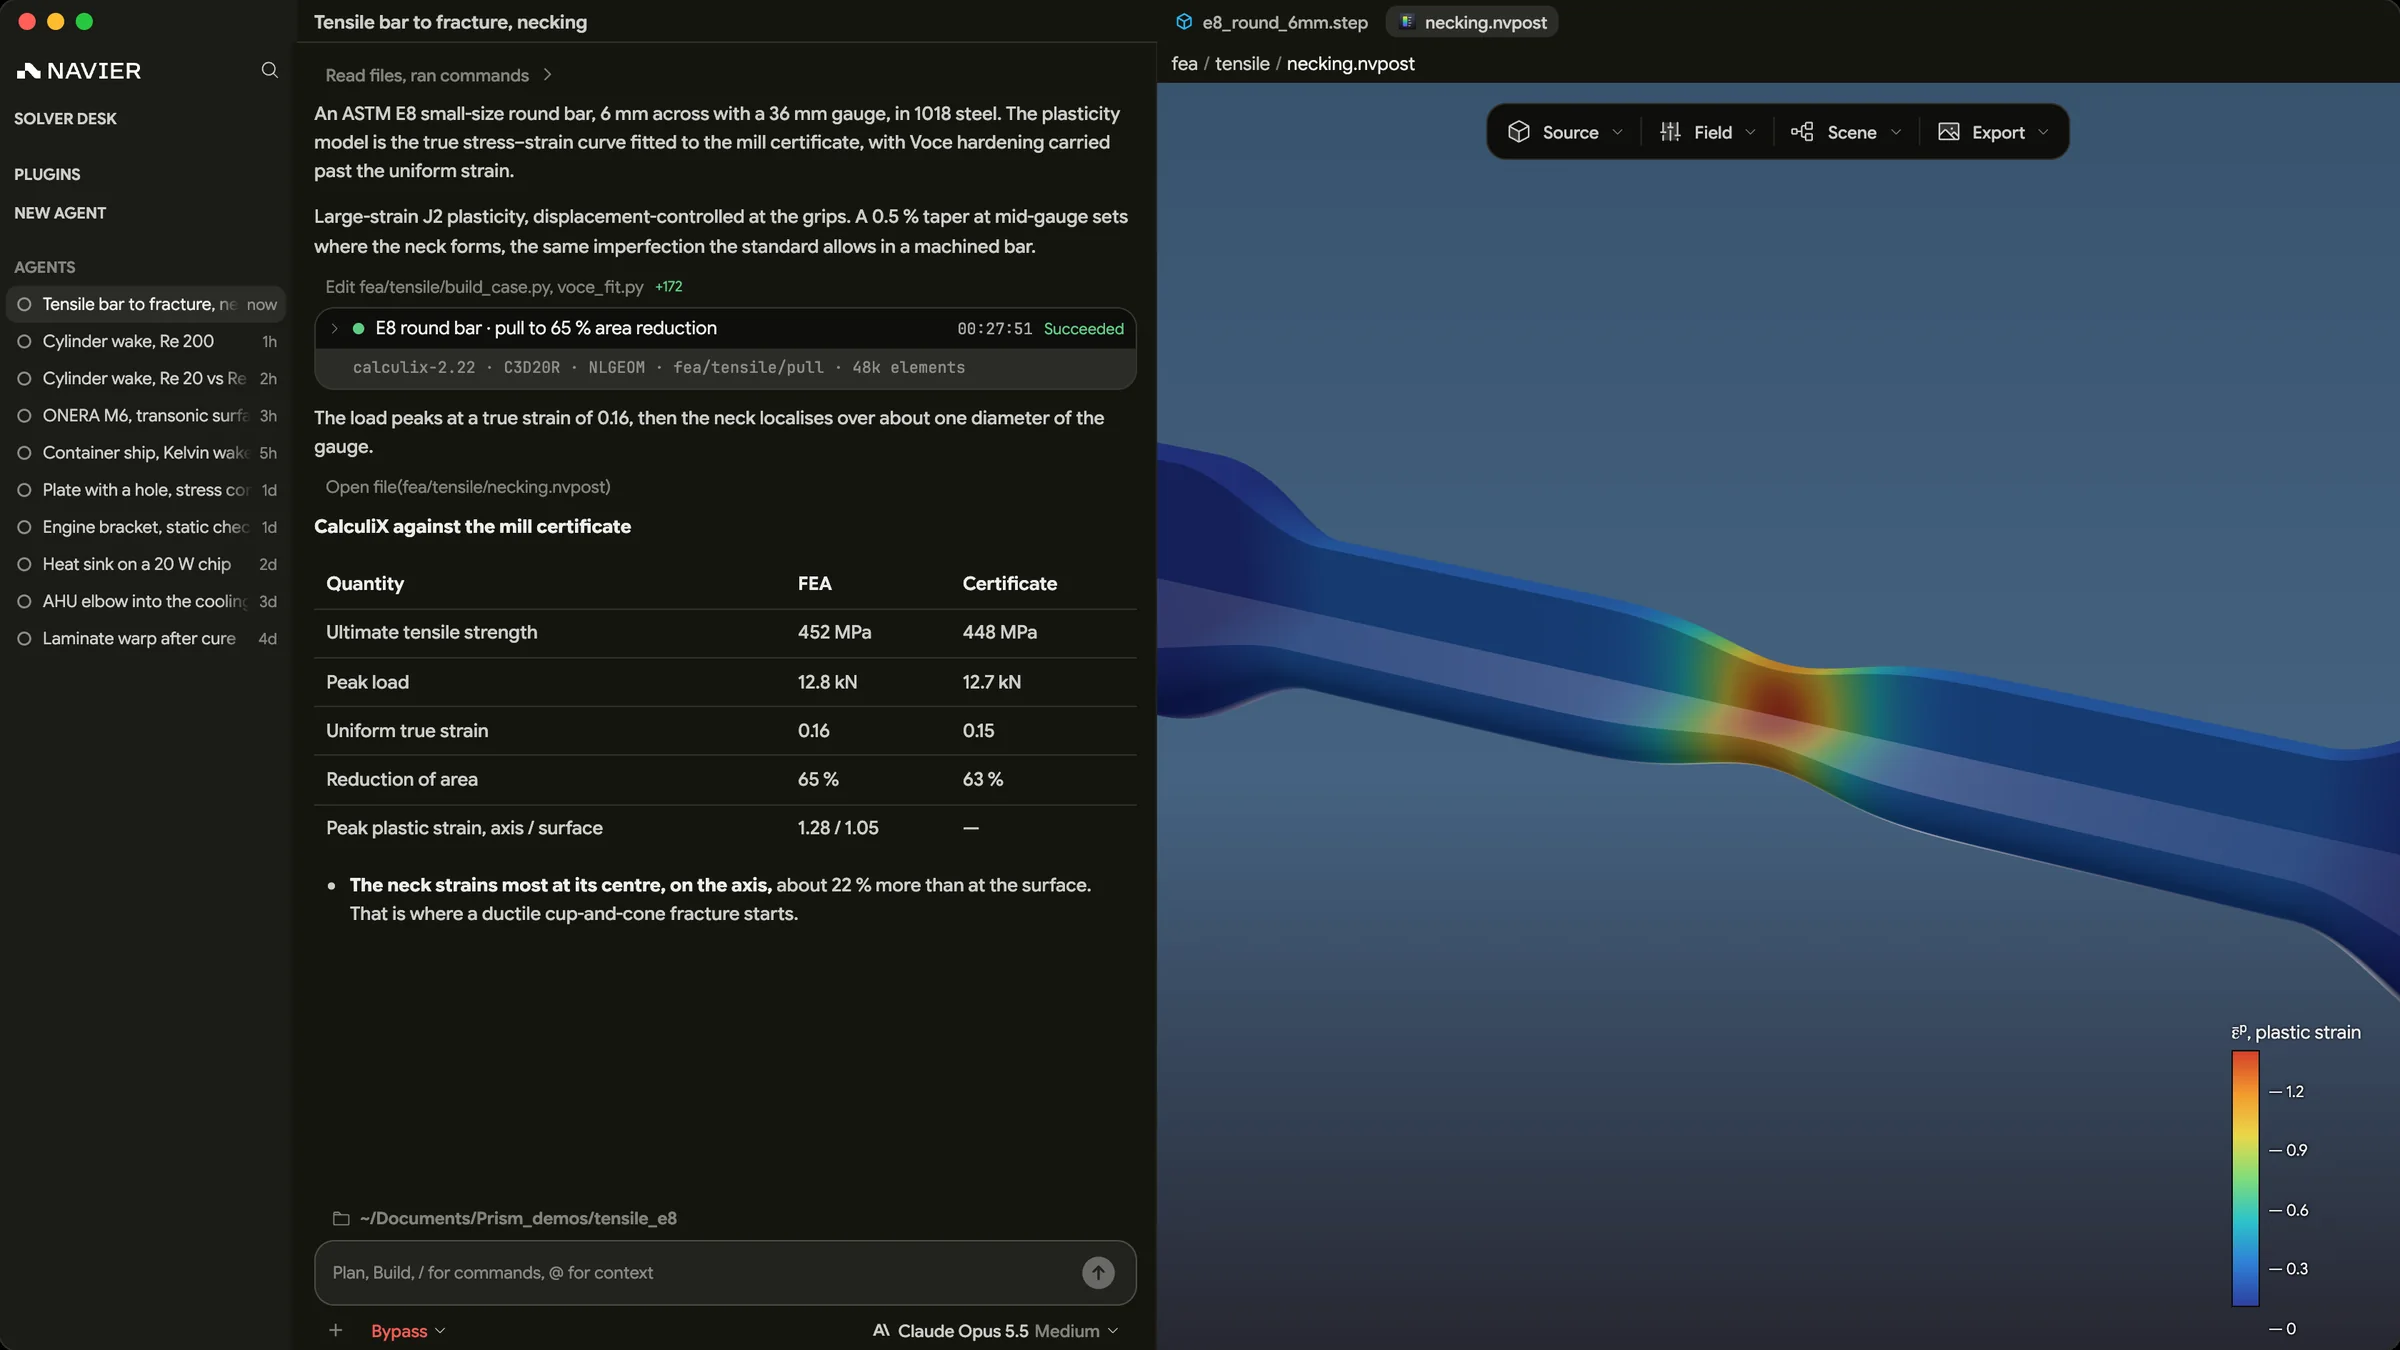
A stress–strain curve shows how a material stretches as it is loaded, usually in a tensile test. It gives the material's stiffness, the stress where it starts to stretch for good, the most stress it can carry, and how far it stretches before it breaks.
Most of the material data in a structural analysis comes off this curve.
Stress and strain
A tensile test pulls a standard specimen and records force and stretch. These become stress and strain.
and are the original area and length. On the straight first part of the curve, Hooke's law holds.
The slope is Young's modulus.
Reading the curve
| Point | What happens |
|---|---|
| Elastic region | Stress rises in a straight line. Unload and the part springs back |
| Yield strength | Permanent stretch begins. Without a sharp yield point it is read at 0.2% offset |
| Strain hardening | The material keeps taking more load as it stretches |
| Ultimate strength | The peak of the curve |
| Necking | Stretch concentrates in one spot and the measured stress falls |
| Fracture | The specimen breaks. The stretch at break measures ductility |
Brittle materials such as cast iron, glass and ceramics barely yield. They break near the end of the straight line. Carbon fibre is close to straight up to failure along the fibres.
Typical values
| Material | E, GPa | Yield, MPa | Ultimate, MPa |
|---|---|---|---|
| Structural steel A36 | 200 | 250 | 400 to 550 |
| Aluminium 6061-T6 | 69 | 276 | 310 |
| Titanium Ti-6Al-4V | 114 | 880 | 950 |
A worked example
A 6061-T6 aluminium rod, 10 mm across and 100 mm long, carries 5 kN.
- The area is 78.5 mm², so the stress is 63.7 MPa.
- The strain is .
- The rod stretches 0.092 mm and springs back fully.
The safety factor against yield is 276 / 63.7, about 4.3.
Where it matters
- Linear analysis holds only below yield. A linear FEA result above yield isn't a real stress. The part would yield and shed load elsewhere.
- Plasticity models need true stress and true strain, which account for the shrinking area.
- Ductility decides whether a part bends visibly before it fails or snaps without warning.
Common mistakes
- Feeding the engineering curve into a plasticity model. It understates the hardening.
- Designing to ultimate strength when the limit that matters is yield.
- Using room-temperature data for a hot part. Aluminium alloys lose strength well before 200 °C.
- Using typical values where the code calls for guaranteed minimums.
Stress–strain curve using Navier AI
Prism runs structural FEA on Ferro, its built-in solver, with CalculiX, code_aster and Elmer available from inside the app. Describe the part, the material, the loads and the supports. The agent builds the model, runs it and reports the stresses against the material's limits.
For a material that doesn't yield at all, see our composite layup study. Carbon/epoxy is checked ply by ply. In every layup the matrix cracks while the fibres stay under 90% of their strength. Download Prism to run your own.
References
- ASTM E8/E8M, Standard Test Methods for Tension Testing of Metallic Materials.
- W. D. Callister and D. G. Rethwisch, Materials Science and Engineering, Wiley.