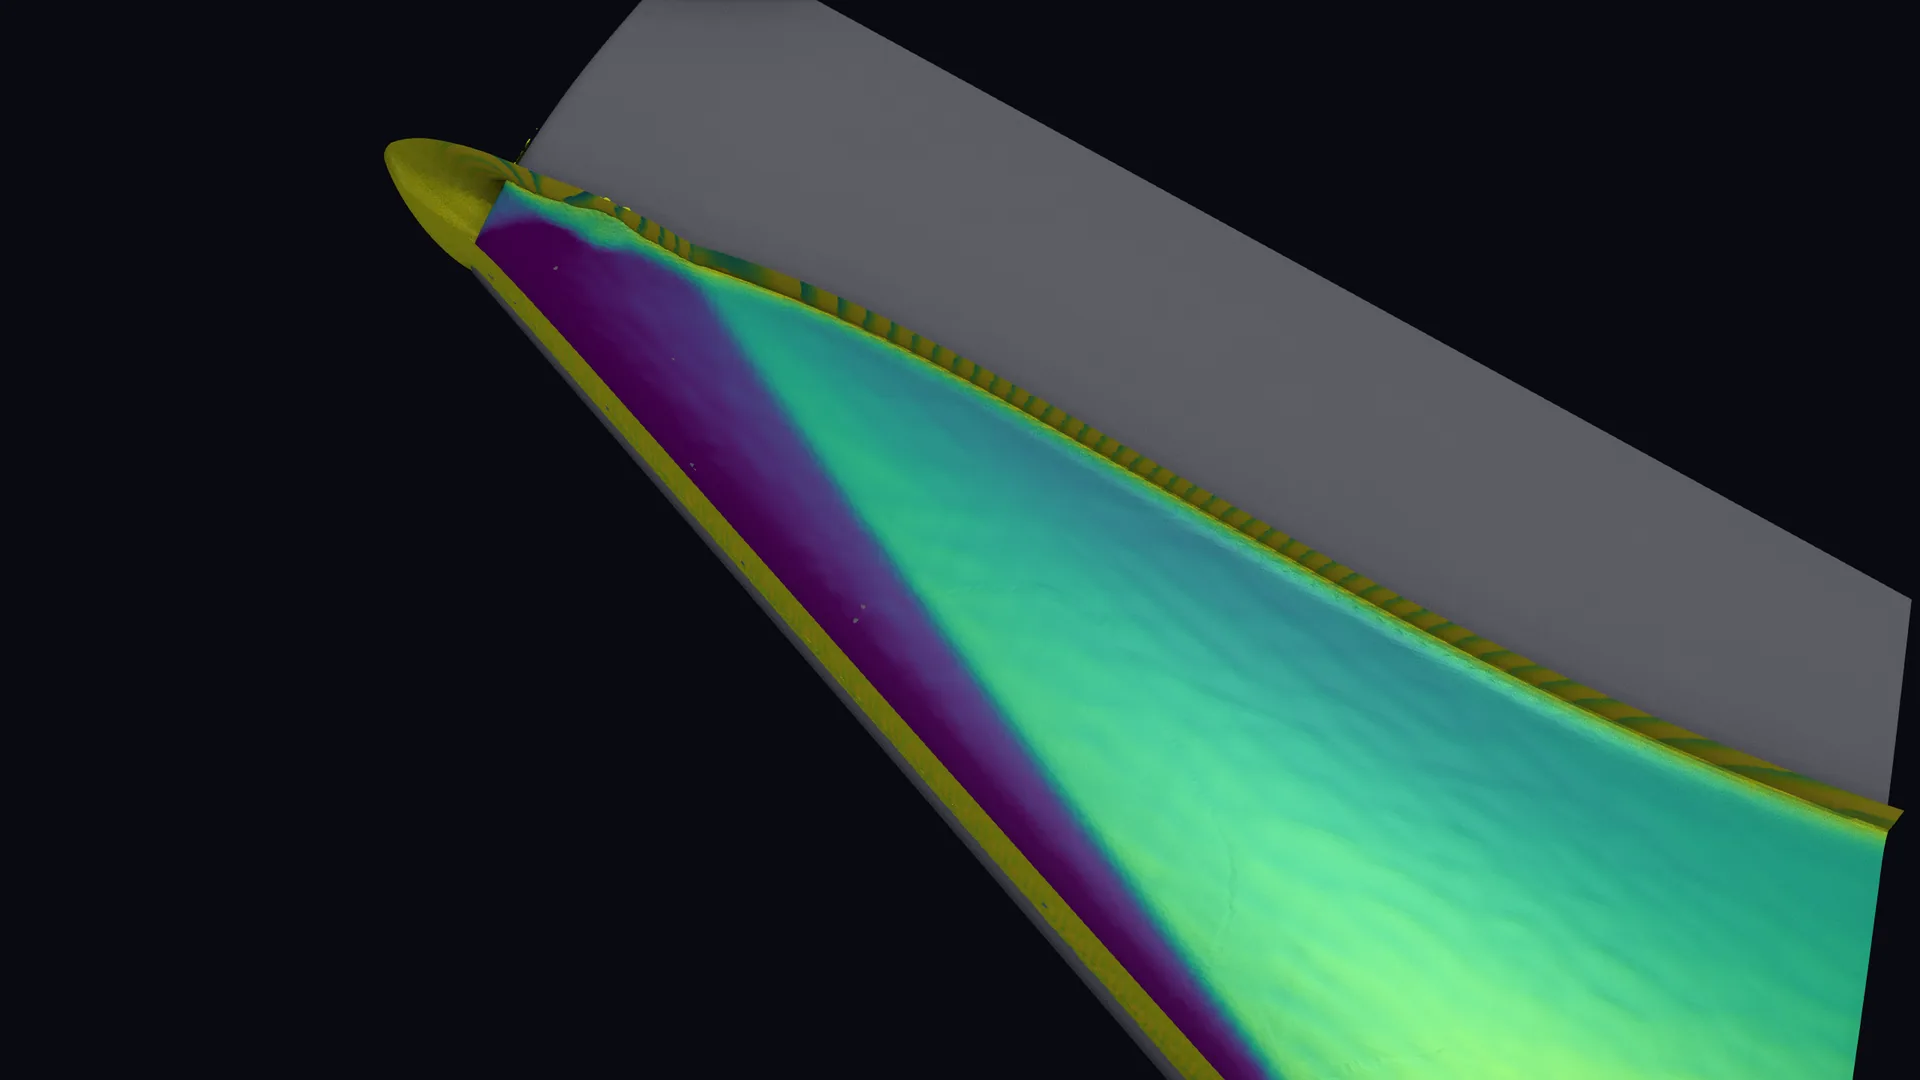
The ONERA M6 wing has been the standard transonic validation case since 1979. At Mach 0.8395 and 3.06° incidence it develops a λ-shock on the upper surface: two separate compressions inboard that merge into a single shock toward the tip. Reproducing that structure — not just an integrated coefficient — is the actual test.
A lift coefficient is one number, and one number can be right for the wrong reasons. A shock system is a shape. It has a position at every span station, a topology that changes across the span, and a place where that topology changes. You do not get those by accident.
We ran the case as steady RANS with the Spalart–Allmaras model, using HiSA, a density-based solver built against OpenFOAM v2412. The flux scheme matters here: with AUSM+up and a van Leer limiter the compression stays inside about three cells instead of smearing across ten, and a smeared shock defeats the purpose of the benchmark.
12,962,287 cells. 3000 iterations. One overnight run. Lift drifted 0.011% over the final 500 iterations — flat to five significant figures.
What is being compared to what
AGARD AR-138 contains surface pressure distributions and nothing else. There is no experimental lift or drag for the ONERA M6; the report marks aerodynamic coefficients "not relevant," and ONERA state the database consists exclusively of pressure distributions.
So this study has two halves, and they carry different weight:
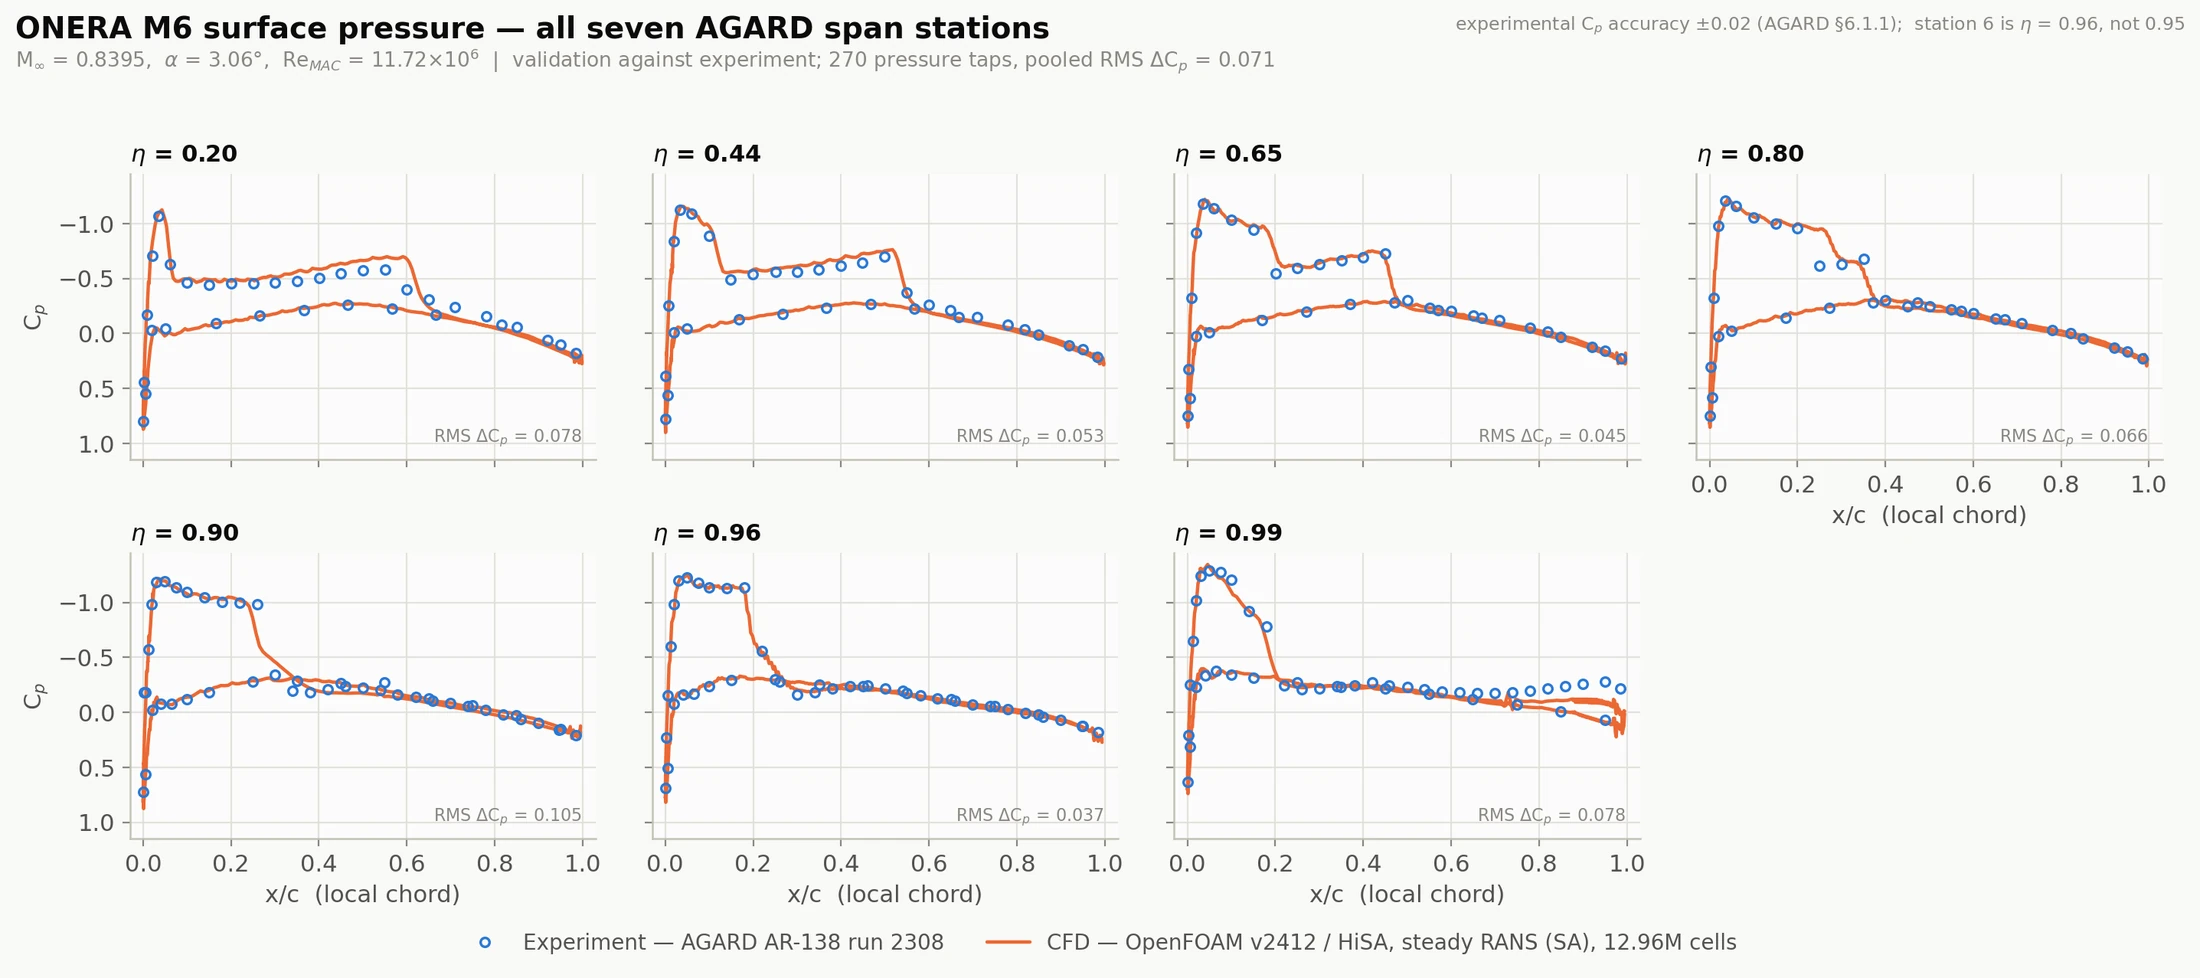
- Surface Cp at the seven AGARD span stations is validation against experiment. 271 published taps, 270 of them comparable — one at η = 0.80 falls outside the CFD abscissa. Measured in a wind tunnel at Modane.
- CL, CD and CMy are code-to-code comparison. The reference is NASA's Turbulence Modeling Resource SA-neg multi-code study (AIAA 2018-1102) — five solutions from four codes, four of them at 61–363 million cells, at the converged end of a grid-refinement study.
Both are useful. Only one is validation, and we label it that way everywhere.
Surface pressure, station by station
| η = y/b | RMS ΔCp | Max |ΔCp| | Taps inside ±0.02 |
|---|---|---|---|
| 0.20 | 0.078 | 0.279 | 6 / 34 |
| 0.44 | 0.053 | 0.152 | 11 / 34 |
| 0.65 | 0.045 | 0.192 | 17 / 34 |
| 0.80 | 0.066 | 0.331 | 19 / 33 |
| 0.90 | 0.105 | 0.578 | 24 / 45 |
| 0.96 | 0.037 | 0.134 | 25 / 45 |
| 0.99 | 0.078 | 0.238 | 18 / 45 |
| all | 0.071 | 0.578 | 120 / 270 (44%) |
44% of the taps land inside the measurement's own uncertainty band, and 69% inside twice it. But the distribution of the error is the more useful result.
The lower surface is essentially exact — RMS ΔCp of 0.012 to 0.045 across all stations, at or inside the experiment's own accuracy at four of the seven. It is attached, subsonic and shock-free, and there is nothing hard about it; that is exactly why it is worth checking. If the geometry, the far field, the incidence or the reference normalization were wrong, the lower surface would be wrong too. It is not.
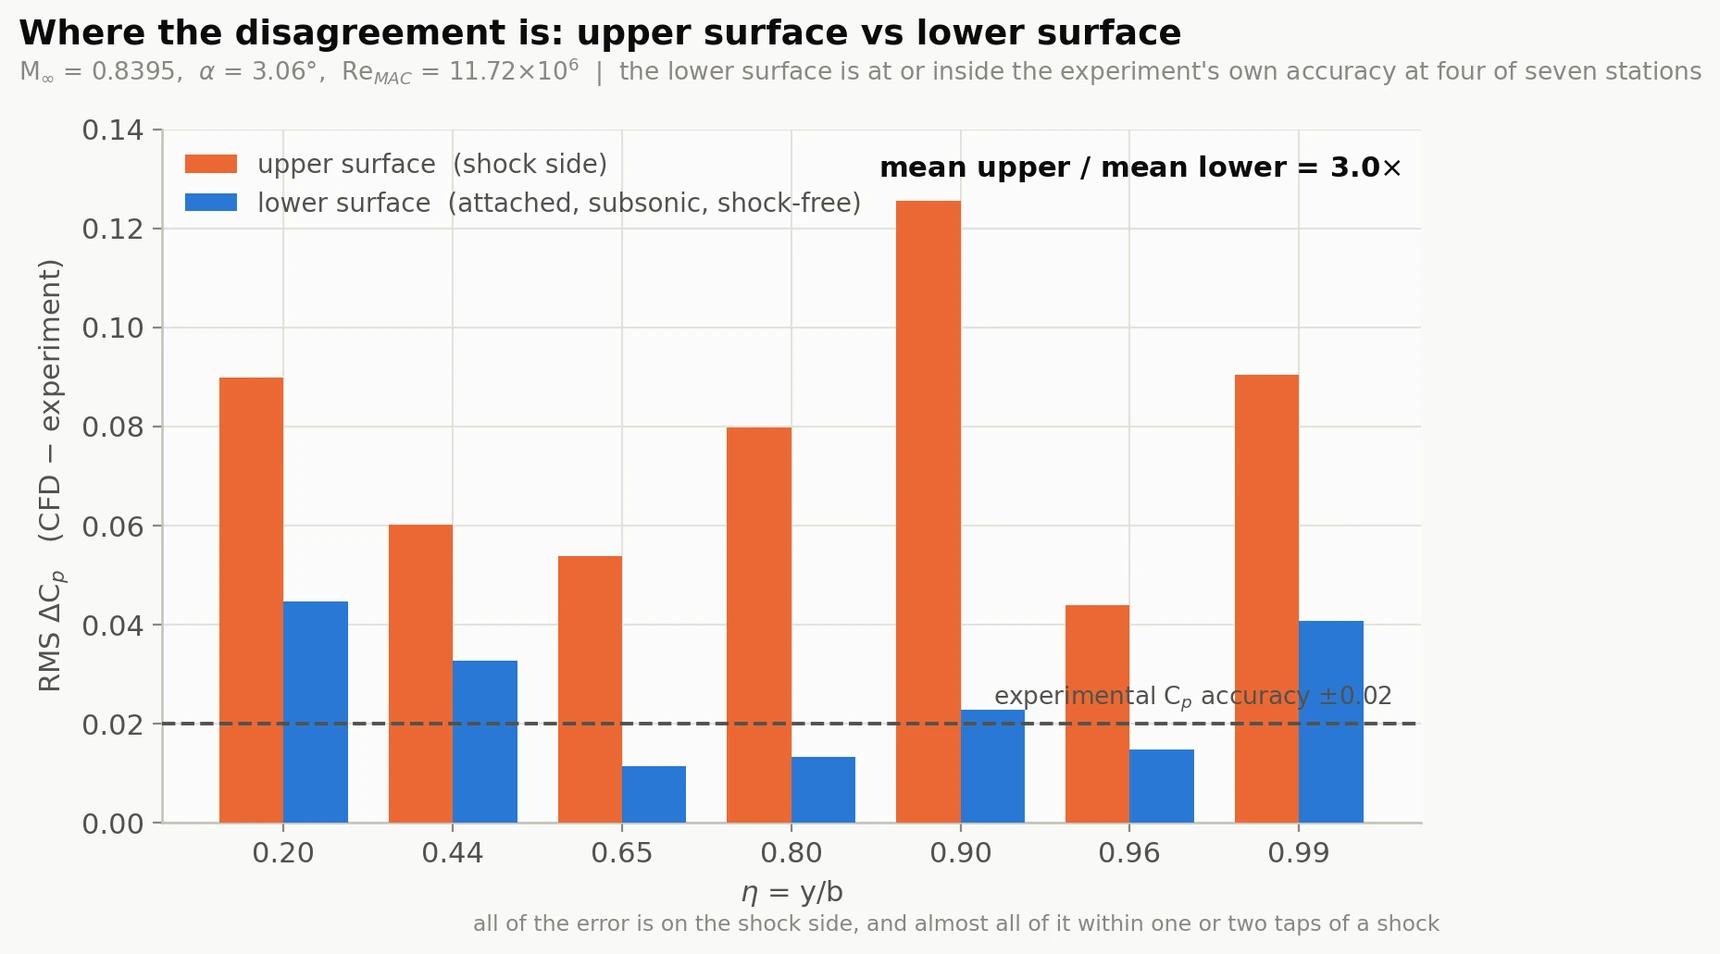
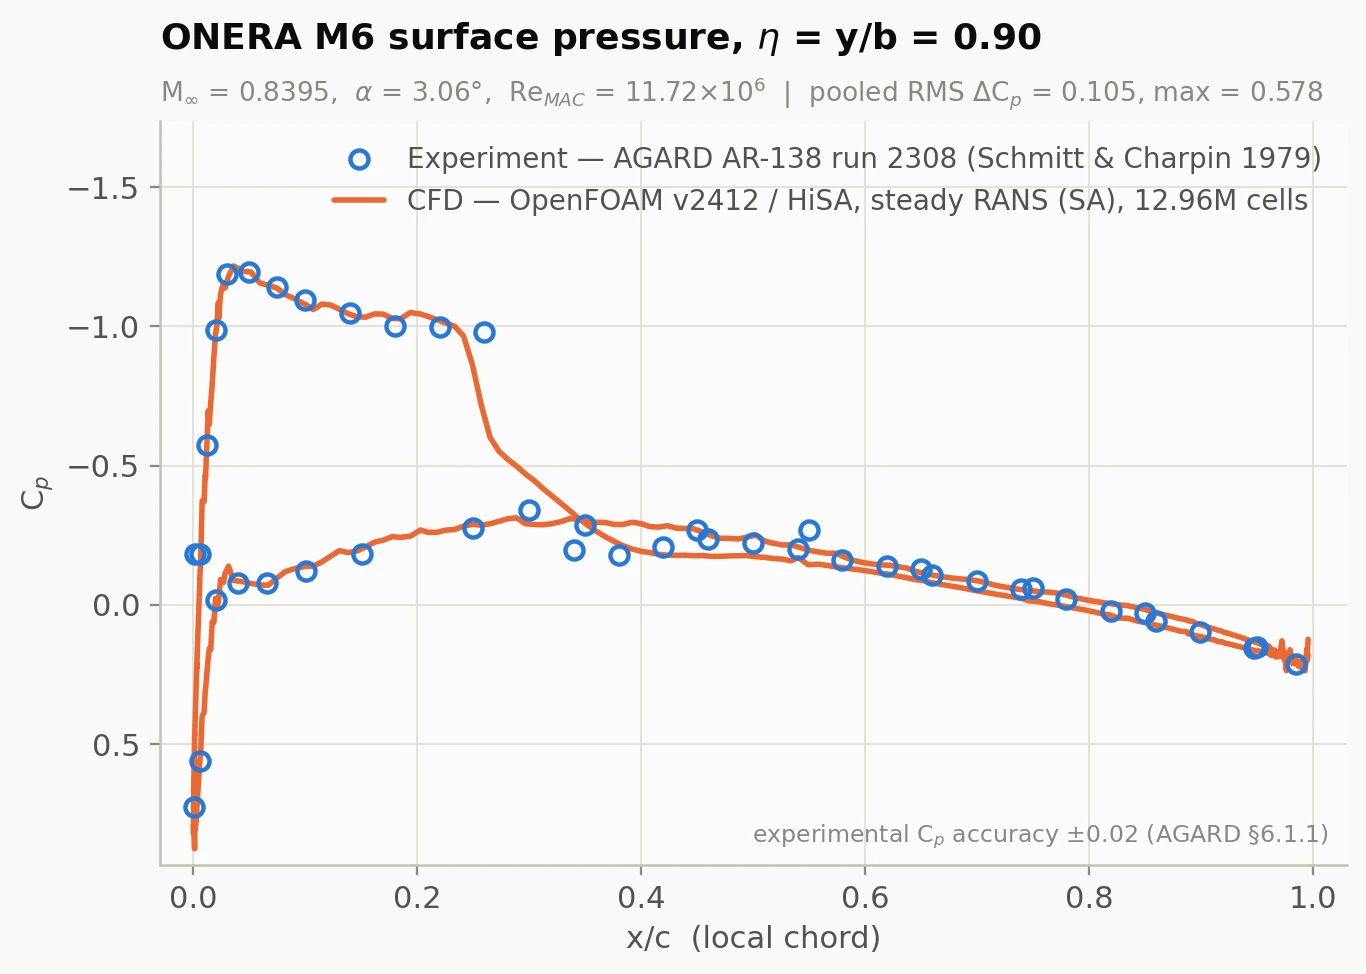
Virtually all of the disagreement is on the upper surface, and virtually all of that is within one or two taps of a shock. A shock displaced by 0.03 chord produces a pointwise ΔCp of order the shock's own Cp jump while the rest of the profile lies on top of the data. That is precisely the pattern in the figure above — and it is why RMS ΔCp is 0.037 at η = 0.96 and 0.105 at η = 0.90, two stations 6% of semi-span apart. A modeling error would not be that localized. A shock-position error at a station where the shock is strong is.
The λ
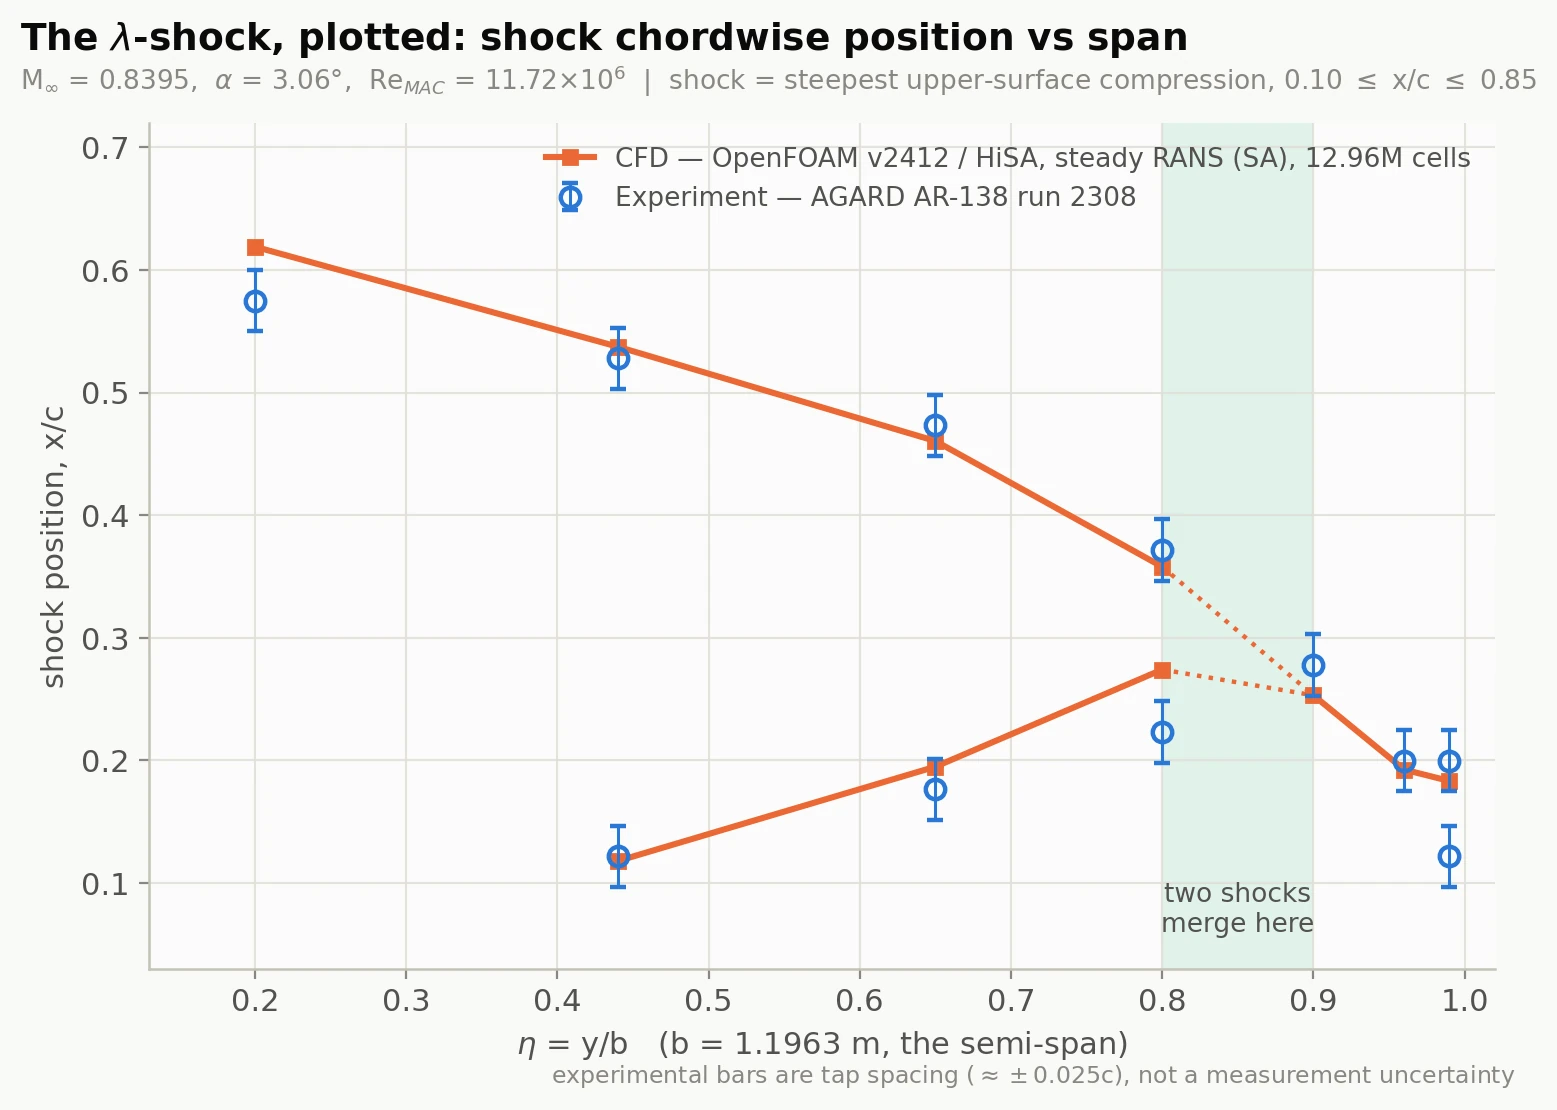
| η | Experiment, x/c | This run, x/c | Δ |
|---|---|---|---|
| 0.20 | 0.575 | 0.619 | +0.044c |
| 0.44 | 0.122 / 0.528 | 0.118 / 0.537 | −0.004c / +0.009c |
| 0.65 | 0.176 / 0.473 | 0.195 / 0.461 | +0.019c / −0.012c |
| 0.80 | 0.223 / 0.372 | 0.274 / 0.358 | +0.051c / −0.014c |
| 0.90 | 0.278 (merged) | 0.253 (merged) | −0.025c |
| 0.96 | 0.200 | 0.192 | −0.008c |
| 0.99 | 0.122 / 0.200 | 0.183 | inside tap spacing |
The double-shock structure is captured. Two distinct compressions exist at η = 0.44, 0.65 and 0.80 in both the experiment and the simulation, and both collapse to a single shock by η = 0.90. The merge therefore occurs between η = 0.80 and η = 0.90 in our solution — matching NASA's independent choice of η = 0.80 as the shock-intersection station, and ONERA's own description of "two shocks merging" for this run.
At four of the seven stations the shock sits inside the experiment's tap spacing. Where it misses, it misses in a coherent direction: the forward branch is aft of measured inboard, and the merged shock is forward of measured outboard. Our λ is a little more swept than the measured one. That is one error with one shape, not seven independent ones.
Getting shock topology right while getting shock position slightly wrong is a different and more encouraging class of result than matching an integrated number.
Forces, against five other codes
| This run | Reference band (5 codes) | vs midpoint | |
|---|---|---|---|
| CL | 0.26718 | 0.26932 – 0.27120 | −1.14% |
| CD | 0.01755 | 0.01695 – 0.01705 | +3.24% |
| CD, pressure | 0.012223 | 0.011654 – 0.011747 | +4.5% |
| CD, viscous | 0.005327 | 0.005232 – 0.005309 | +1.1% |
| CMy | −0.18770 | −0.19187 – −0.18976 | 1.6% less nose-down |
Lift within 1.2% and drag within 3.3% of the band midpoint, on one grid, wall-modeled, with no tuning. The largest of those solutions ran 28× our cell count.
The diagnosis we got wrong
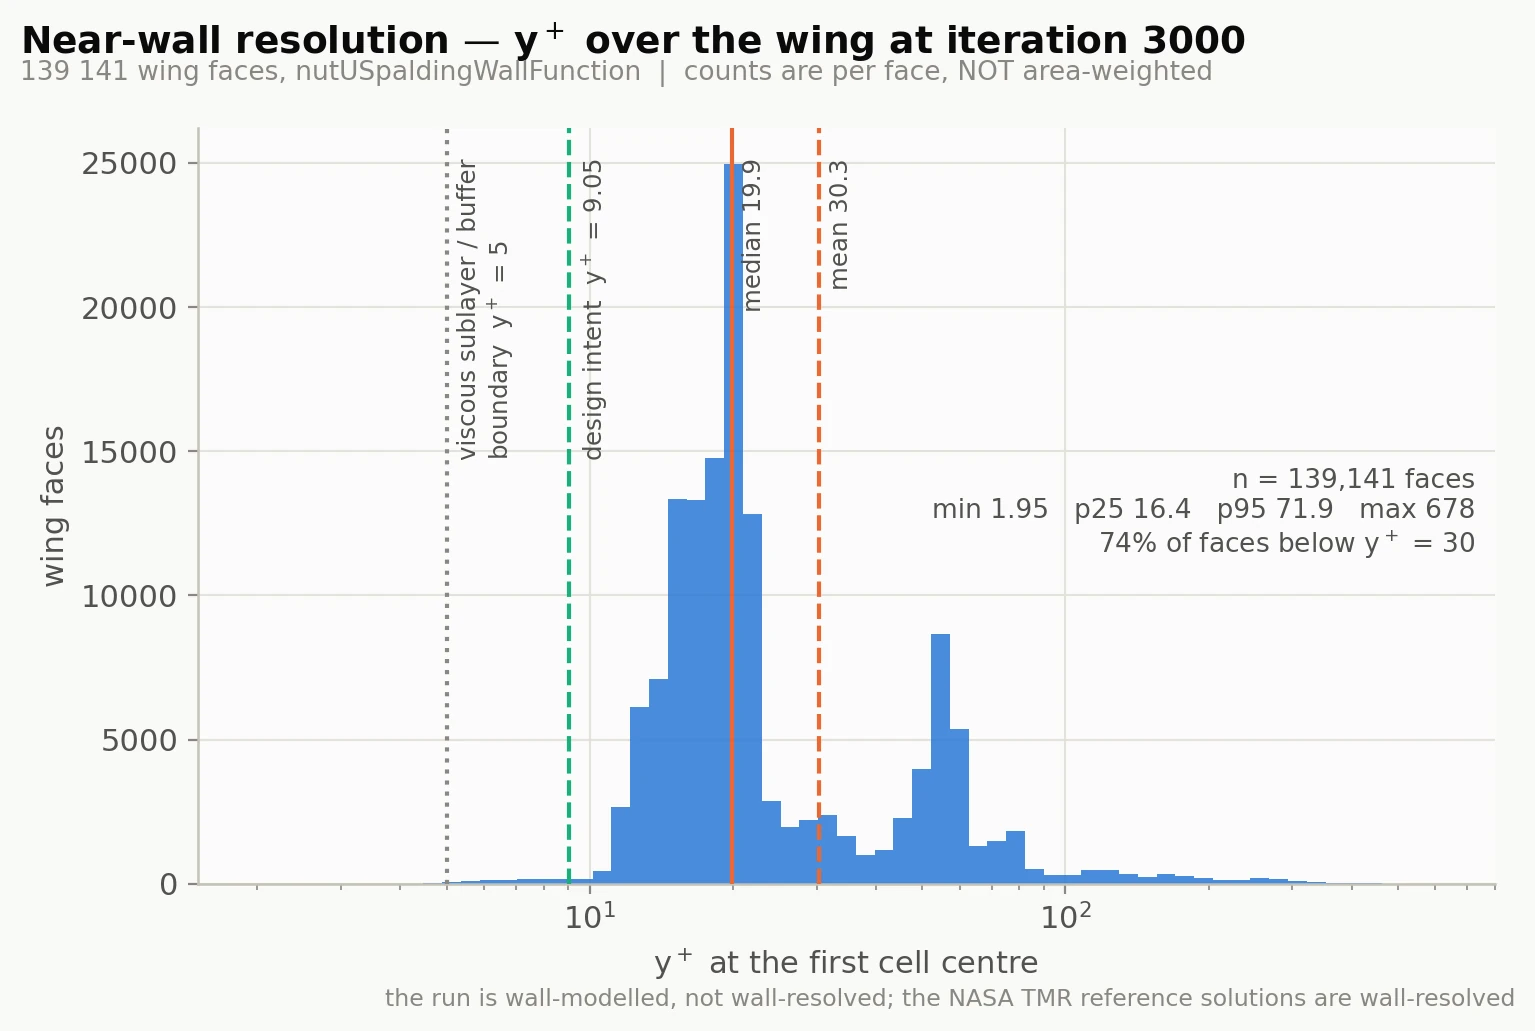
Our first explanation for the +3.2% drag was the obvious one. We ran wall functions at a mean y⁺ of 30, against wall-resolved reference computations. Under-resolved shock/boundary-layer interaction, therefore too much drag. The arithmetic even worked: viscous drag is about 0.0053 of a total 0.0170, so a 10% error in the viscous part alone is roughly +3% on CD — the size of the discrepancy observed.
It was a good hypothesis. It was also testable, and the test killed it.
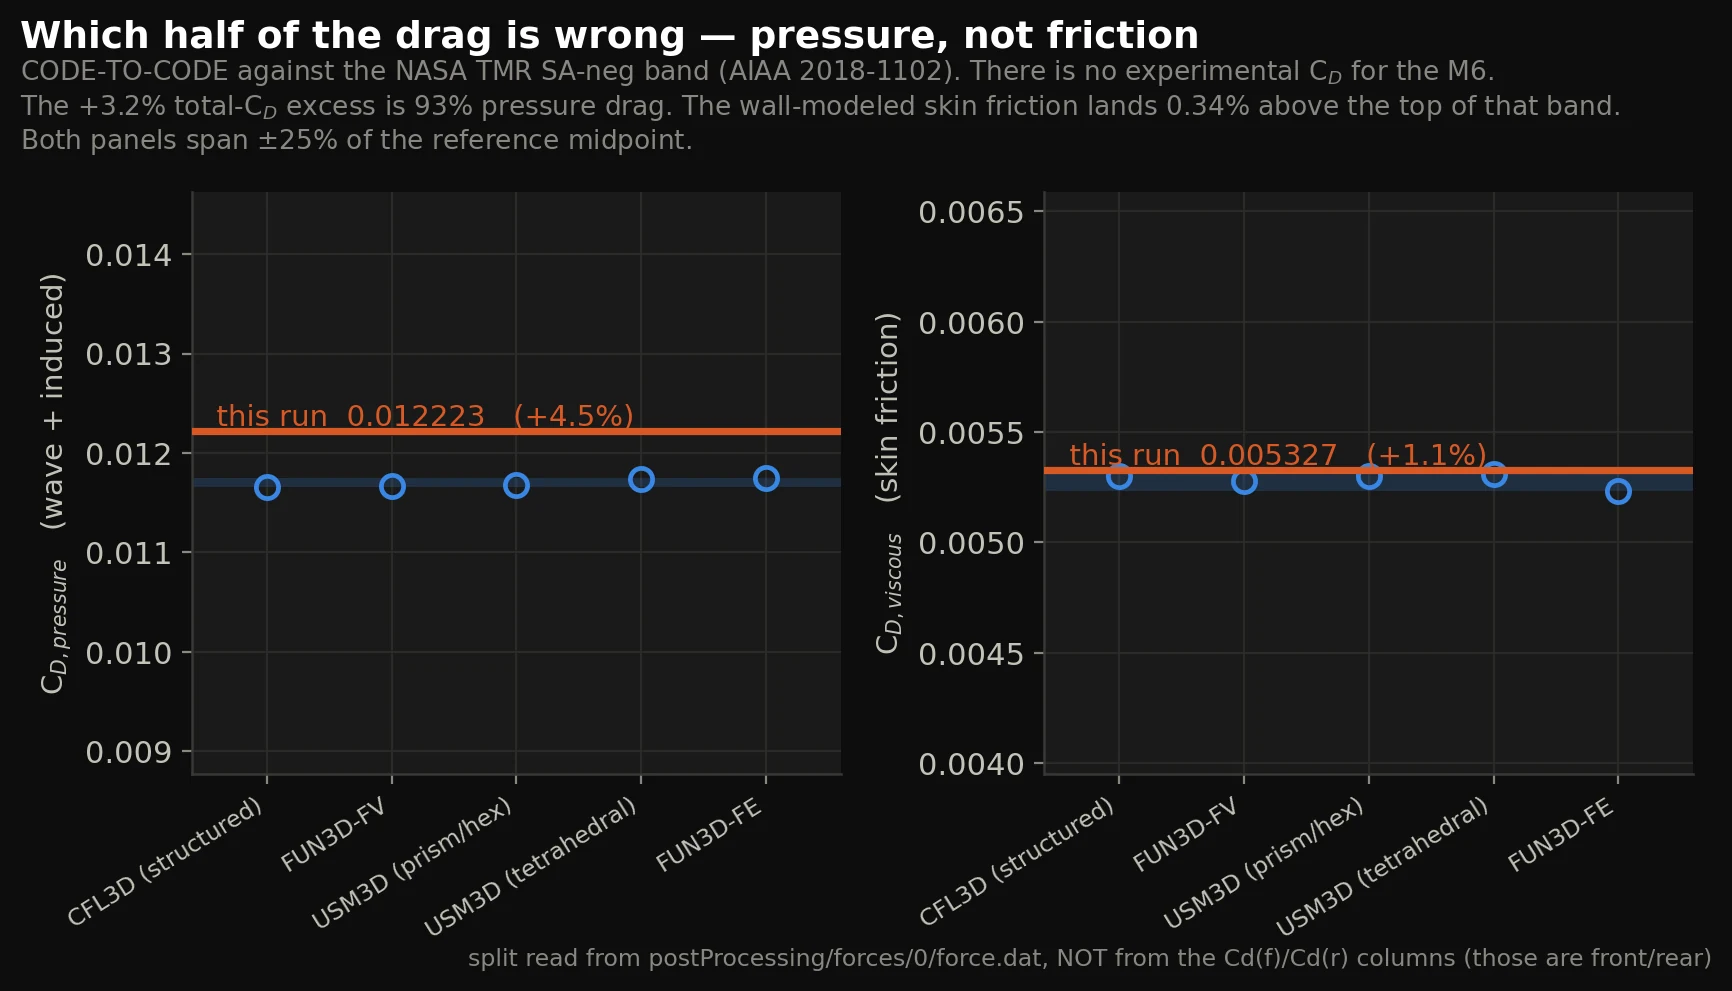
Splitting the drag into pressure and viscous parts puts 93% of the excess in pressure drag. The wall-modeled skin friction lands 1.1% from the midpoint of five wall-resolved codes whose own spread is 1.5% — essentially inside their scatter. The wall-function hypothesis predicts an error in the component that is correct, and no error in the component that is wrong.
That is a genuinely useful result in its own right, and it is the one we would carry to another case: a well-built wall-modeled mesh delivers wall-resolved skin friction on a swept transonic wing.
The pitching moment closes the argument. CMy comes out 1.6% less nose-down than the reference band. A shock sitting forward truncates the upper-surface suction earlier, moves the center of pressure forward, and reduces the nose-down moment.
Low lift, high pressure drag, and a light nose-down moment are not three defects. They are one: the shock sits slightly too far forward.
Three independent integrals point at one shock-position error rather than at three separate problems. That is what a diagnosis looks like when it is finished.
A trap worth knowing
OpenFOAM's forceCoeffs function object writes Cd(f) and Cd(r) columns. These are a front/rear split derived from the pitching moment, not a friction/pressure split.
In our case they read 0.2227 and −0.2051, and they sum to the correct total. A careless reading survives a sanity check and yields an entirely fictitious "viscous drag" of 93% of the total. The pressure/viscous decomposition has to come from the forces function object, which writes total, pressure and viscous force vectors in newtons.
The grid
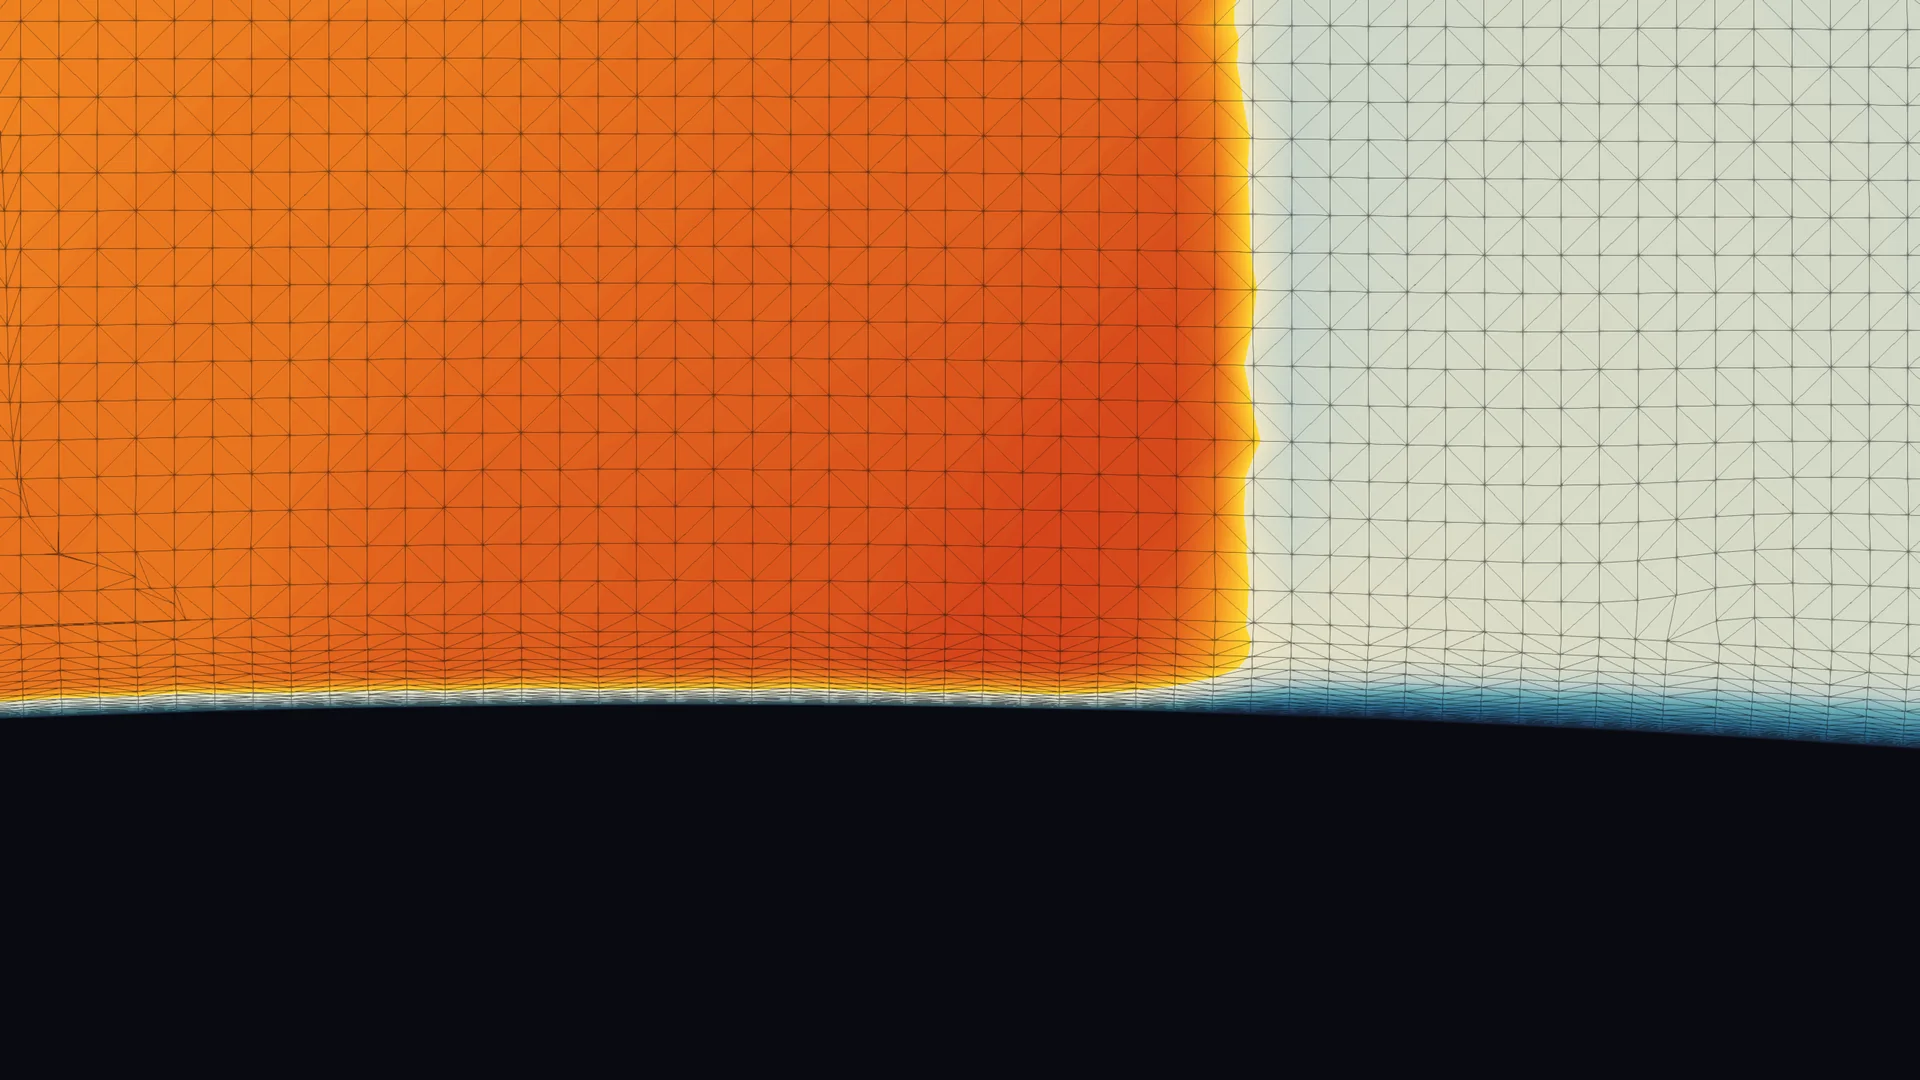
| Cells | 12,962,287 | 96.6% hexahedra, zero tets |
| Non-orthogonality | 4.74° average | max 84.2°; 0.003% of faces above 70° |
| Max skewness | 2.85 | checkMesh: Mesh OK |
| Layer coverage | 96.31% | 20 target layers, 28 µm first cell |
| Far field | 37–56 chords | dedicated box carrying the tip vortex |
The fine shell carries 3.9 mm cells 100 mm off the surface, so the entire supersonic pocket — not just the wall — sits in the fine grid. That is what puts three cells through the shock instead of one.
Layer addition on a 30° swept leading edge normally collapses. Running castellation and snapping with strict quality settings, then layer addition as a separate invocation with relaxed ones, took coverage from 57.6% to 96.31%. Raising the outer iteration count did most of the rest: 57.6% → 80.8% → 90.2% → 93.3%. The default of 3 iterations would have stopped near 90%.
Three things we deliberately did not reuse
This case built on prior in-house work — the official sharp-trailing-edge geometry and the two-stage meshing strategy. Three parts of the earlier setup did not survive contact with the transonic case:
- The AUSM+M flux scheme. Its shock sensor reads near zero on a smeared unstructured shock and switches off the very dissipation holding the shock together.
- The wSuperBee limiter. It overshoots at the 2:1 refinement jumps an octree mesh is full of; combined with unlimited Laplacians it diverged outright.
- An 18-chord domain. Marginal for transonic circulation. Ours is 37–56 chords.
We also found, and re-derived, a force-coefficient error in the earlier run: dragDir and liftDir had been set in body axes, which at 3.06° reports axial force rather than drag. Rotating it into wind axes put the earlier result back in family with the reference. A coefficient that disagrees with a reference by a suspiciously round factor deserves a re-derivation before it is attributed to physics.
What this establishes
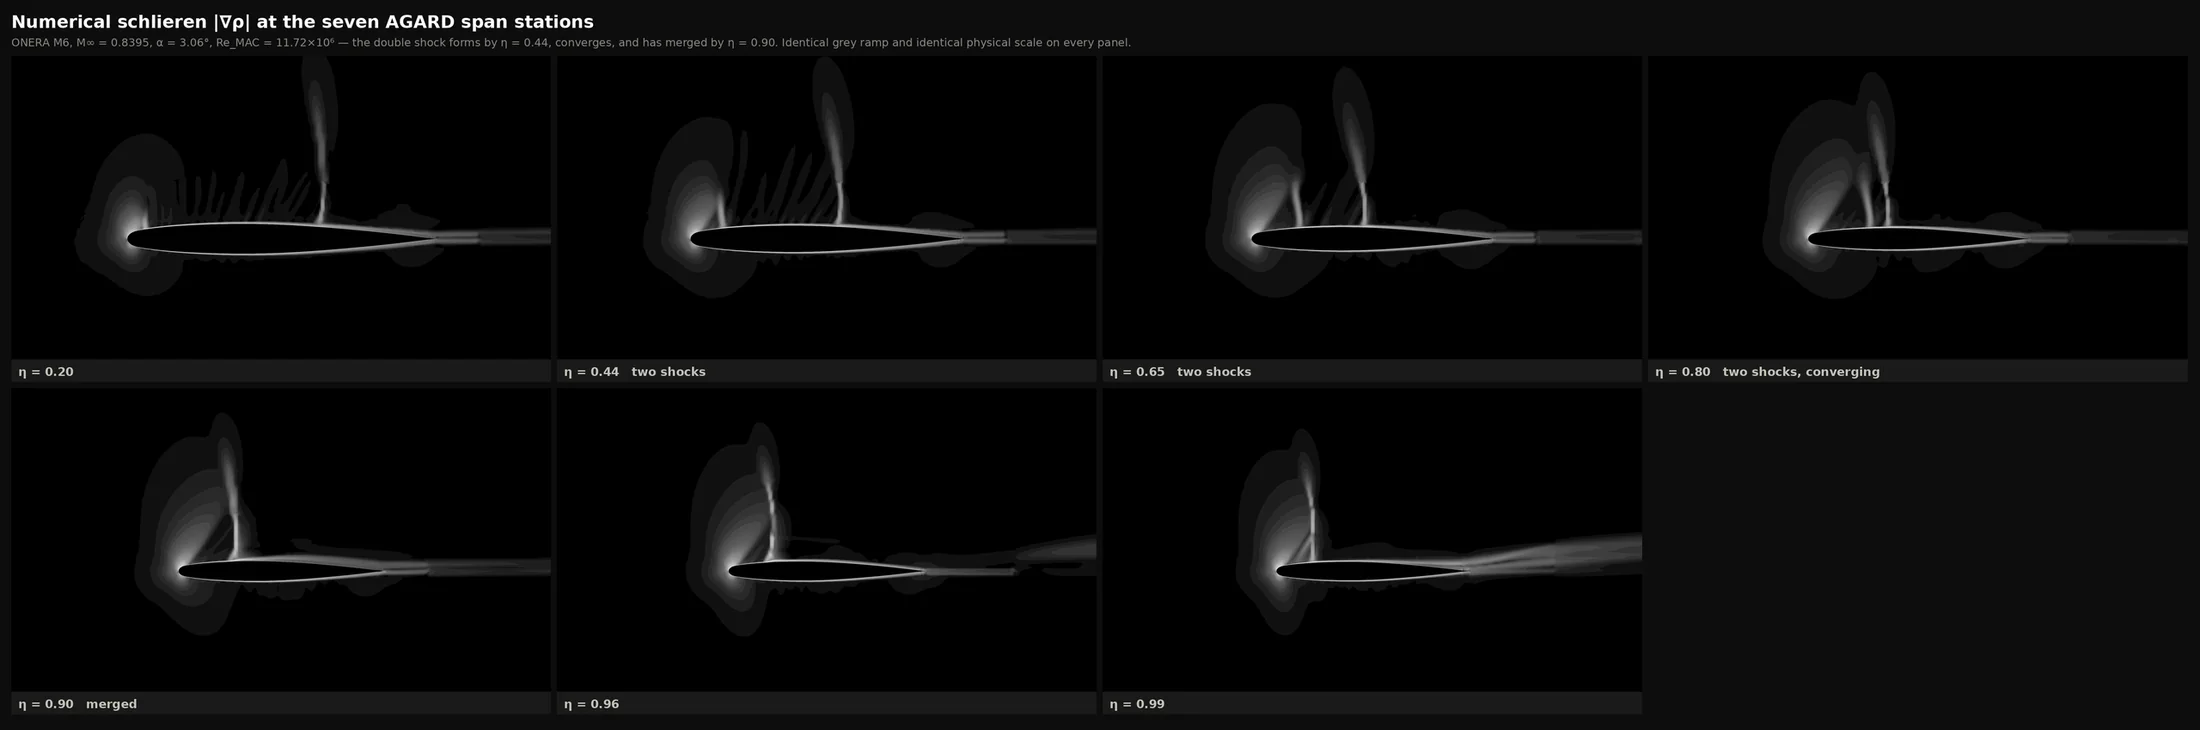
- The double-shock structure is captured, and it merges in the right place — the feature ONERA themselves call "a challenging feature for transonic simulations."
- The lower surface matches to the experiment's own accuracy at four of seven stations, which is as good as the measurement can resolve.
- Skin friction lands 0.34% above the top of a wall-resolved band 1.5% wide at a mean wing y⁺ of 30.
- Lift is within 1.2% and drag within 3.3% of that same band, on one grid, with no tuning.
The next runs are already scoped, and they are cheap: bracket the tunnel's 0.3° upwash by running both 3.06° and 3.36° on the existing mesh, and a three-grid convergence study at √2 spacing to put a number on the discretization error rather than an assumption.
None of that is "validated lift and drag" on the M6. Nobody has that, because the measurement does not exist. What we have is a shock system in the right place, a skin friction within a third of a percent of a wall-resolved band, and every comparison labeled against a public reference anyone can pull.
Simulation: OpenFOAM v2412 + HiSA, steady RANS (Spalart–Allmaras), M∞ = 0.8395, α = 3.06°, Re_MAC = 11.72×10⁶. Experimental reference: AGARD AR-138 (1979) run 2308, via NASA's machine-readable transcription, cross-checked value-by-value against the NPARC Alliance archive. Code-to-code reference: NASA Turbulence Modeling Resource, AIAA 2018-1102.
The visual write-up of this case is at Case Studies — ONERA M6.