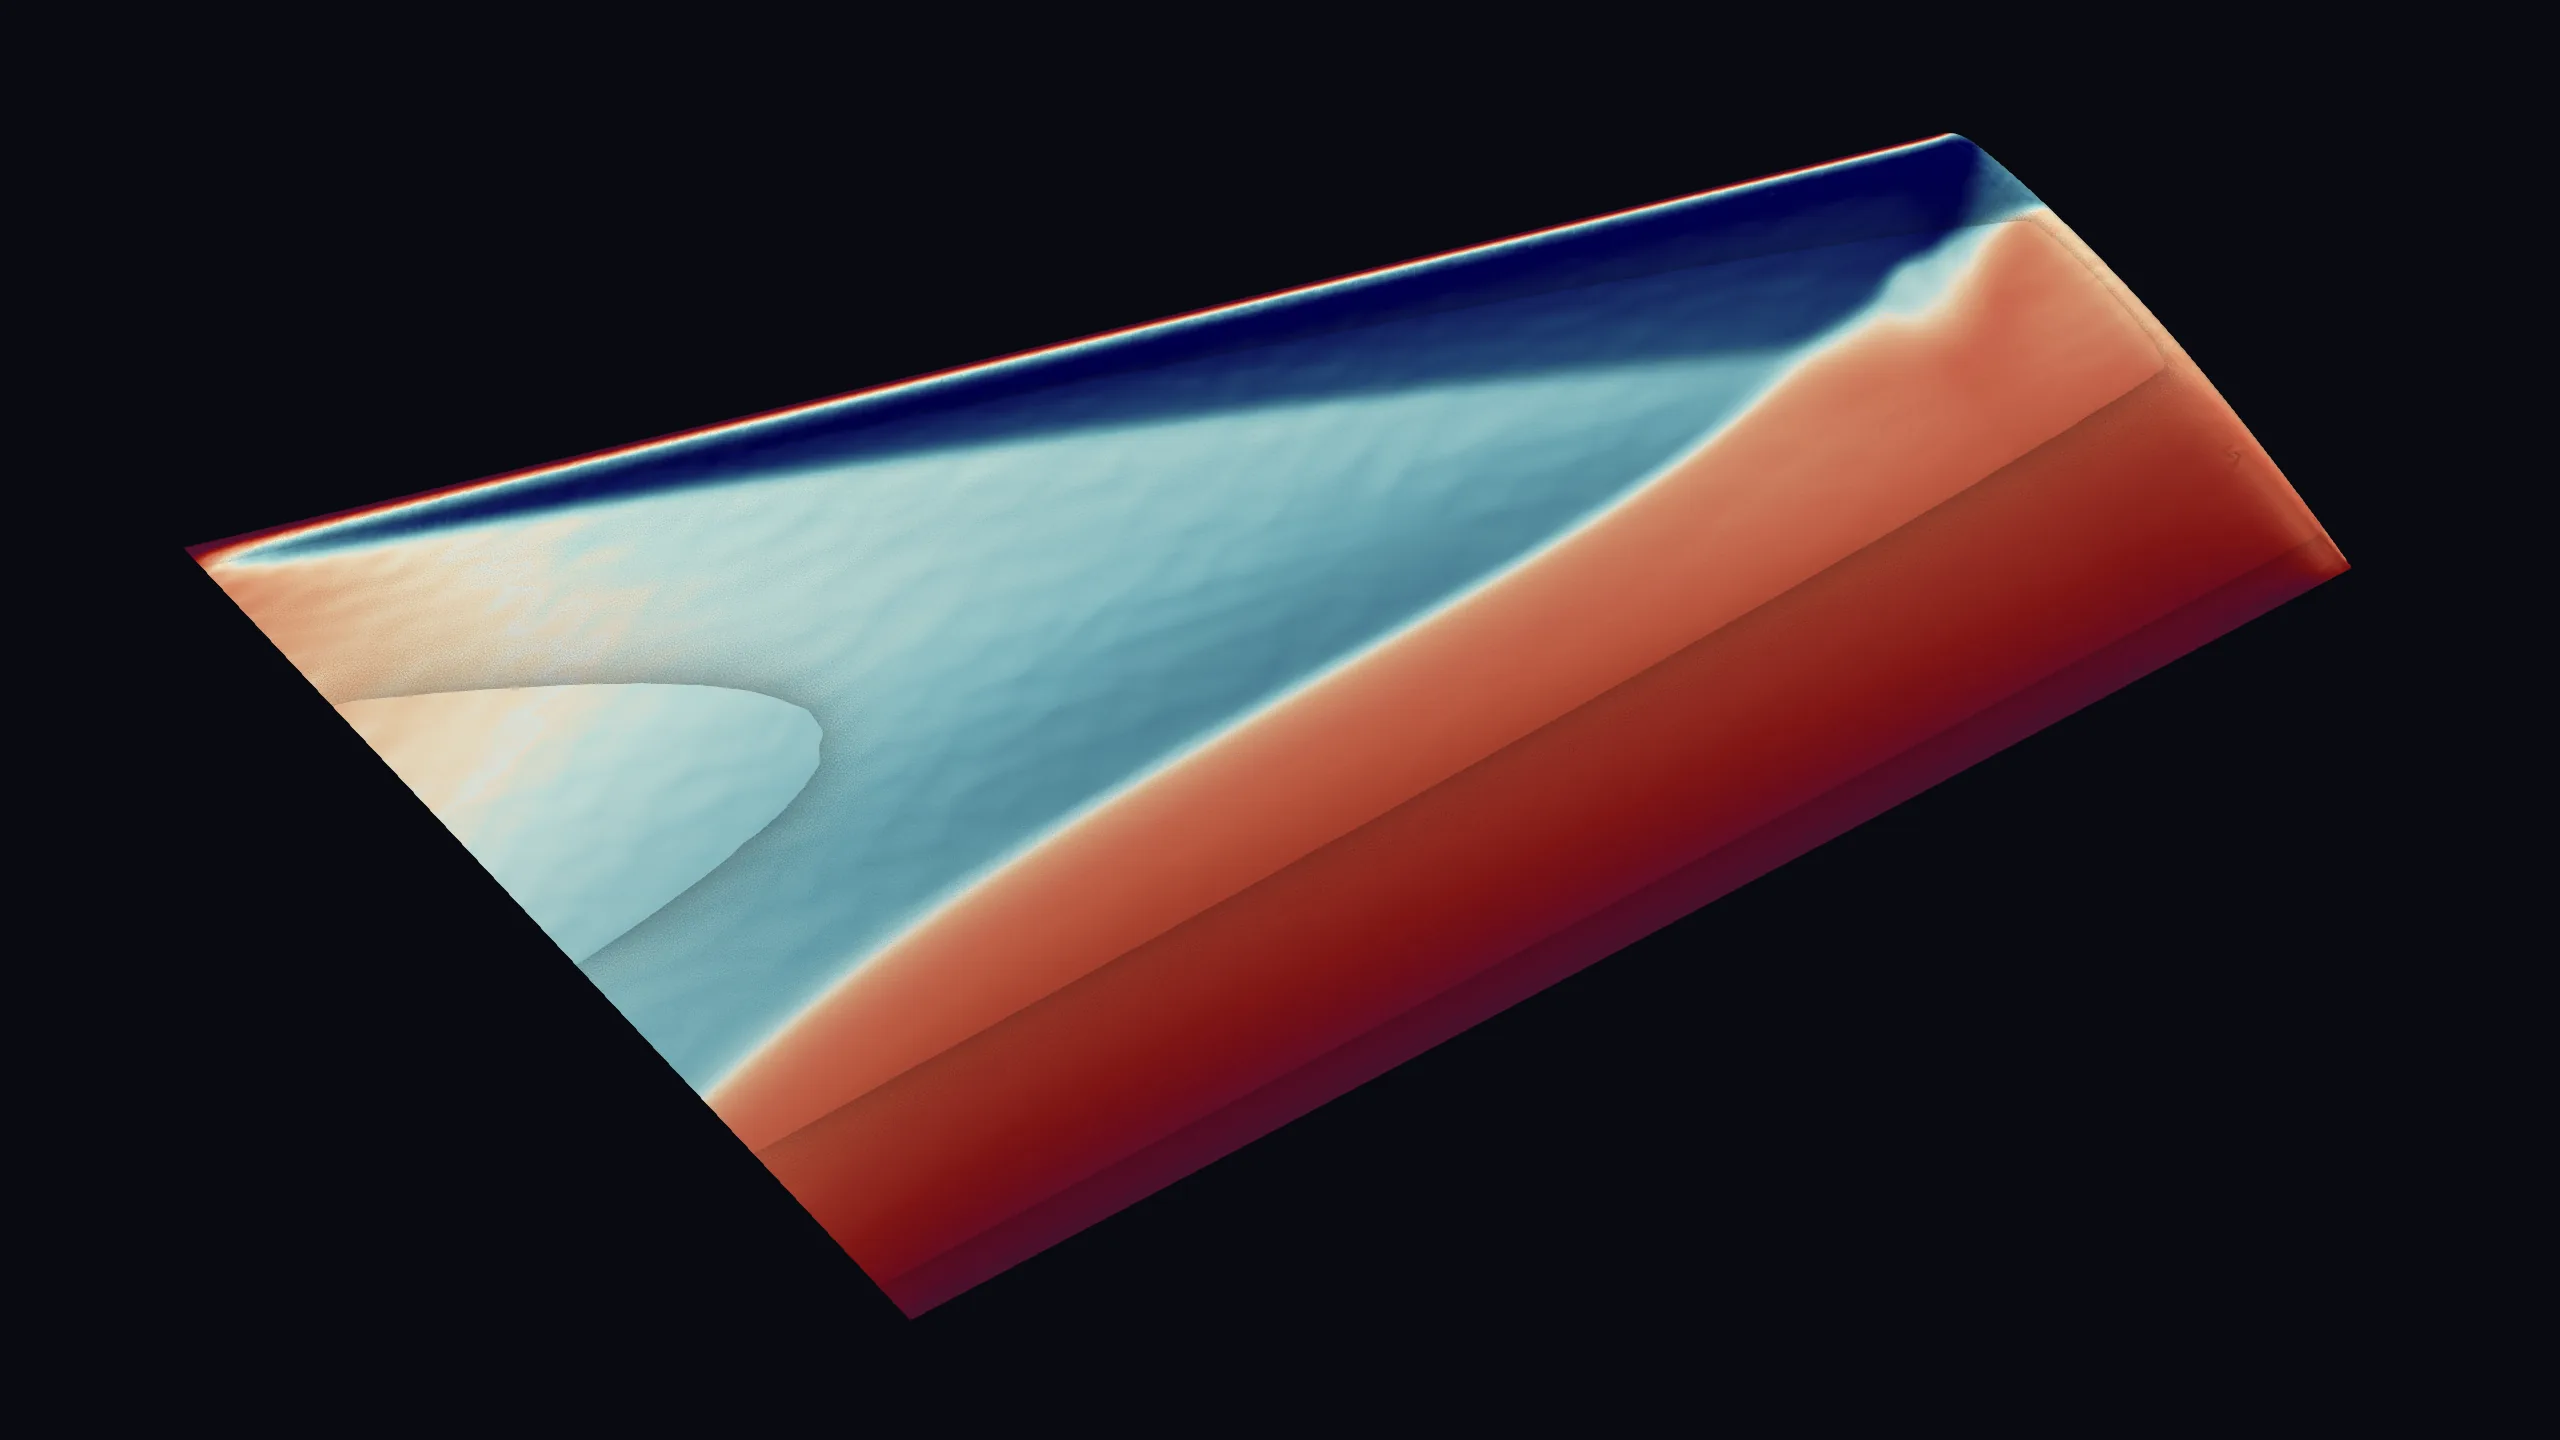
The λ-shock, where the wind tunnel puts it.
The ONERA M6 wing has been the standard transonic benchmark since 1979. We ran it at Mach 0.8395 and 3.06° against 270 of the 271 published pressure taps. The double-shock structure comes out right, and it merges between the span stations the experiment brackets.
270 / 271
PRESSURE TAPS COMPARED
0.071
POOLED RMS ΔCp
12.96 M
CELLS
OVERNIGHT
GEOMETRY TO SOLVED RESULT
THE ACTUAL TEST
Anyone can match a lift coefficient. The M6 asks for the shock structure.
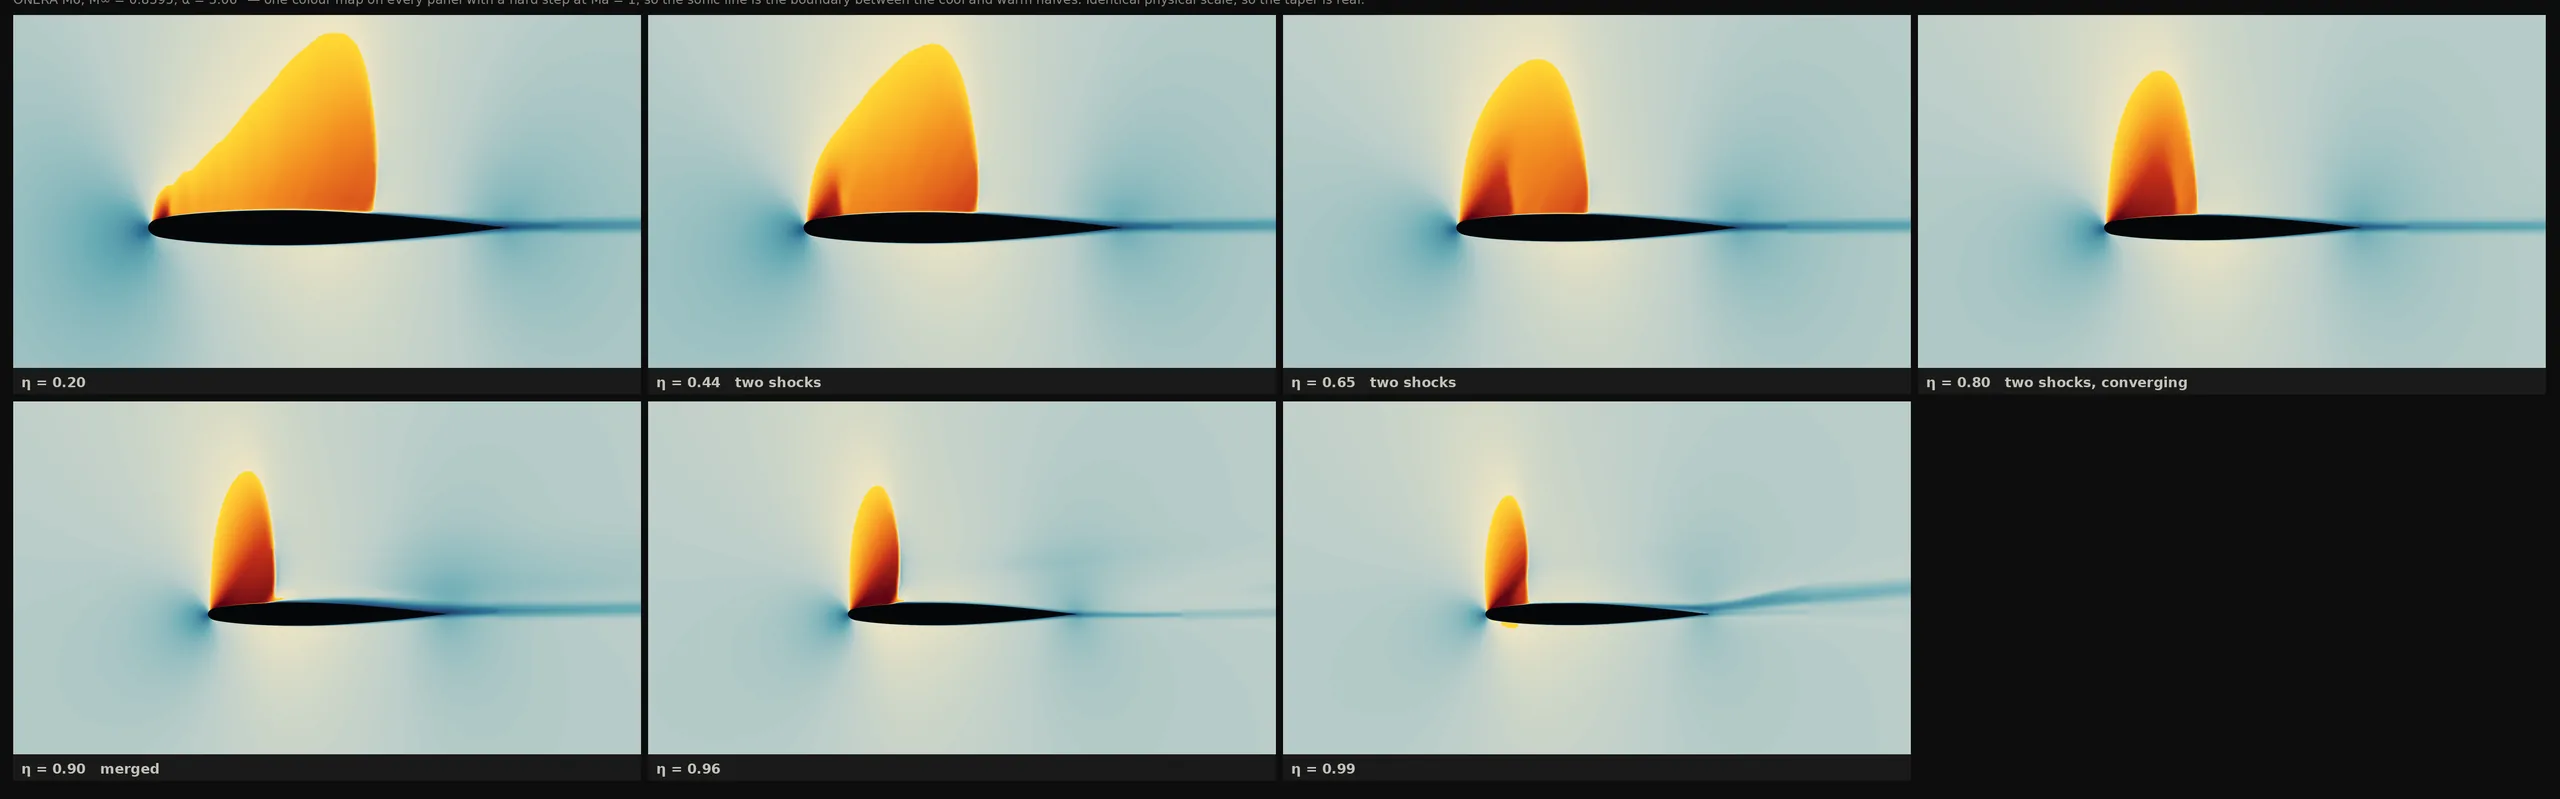
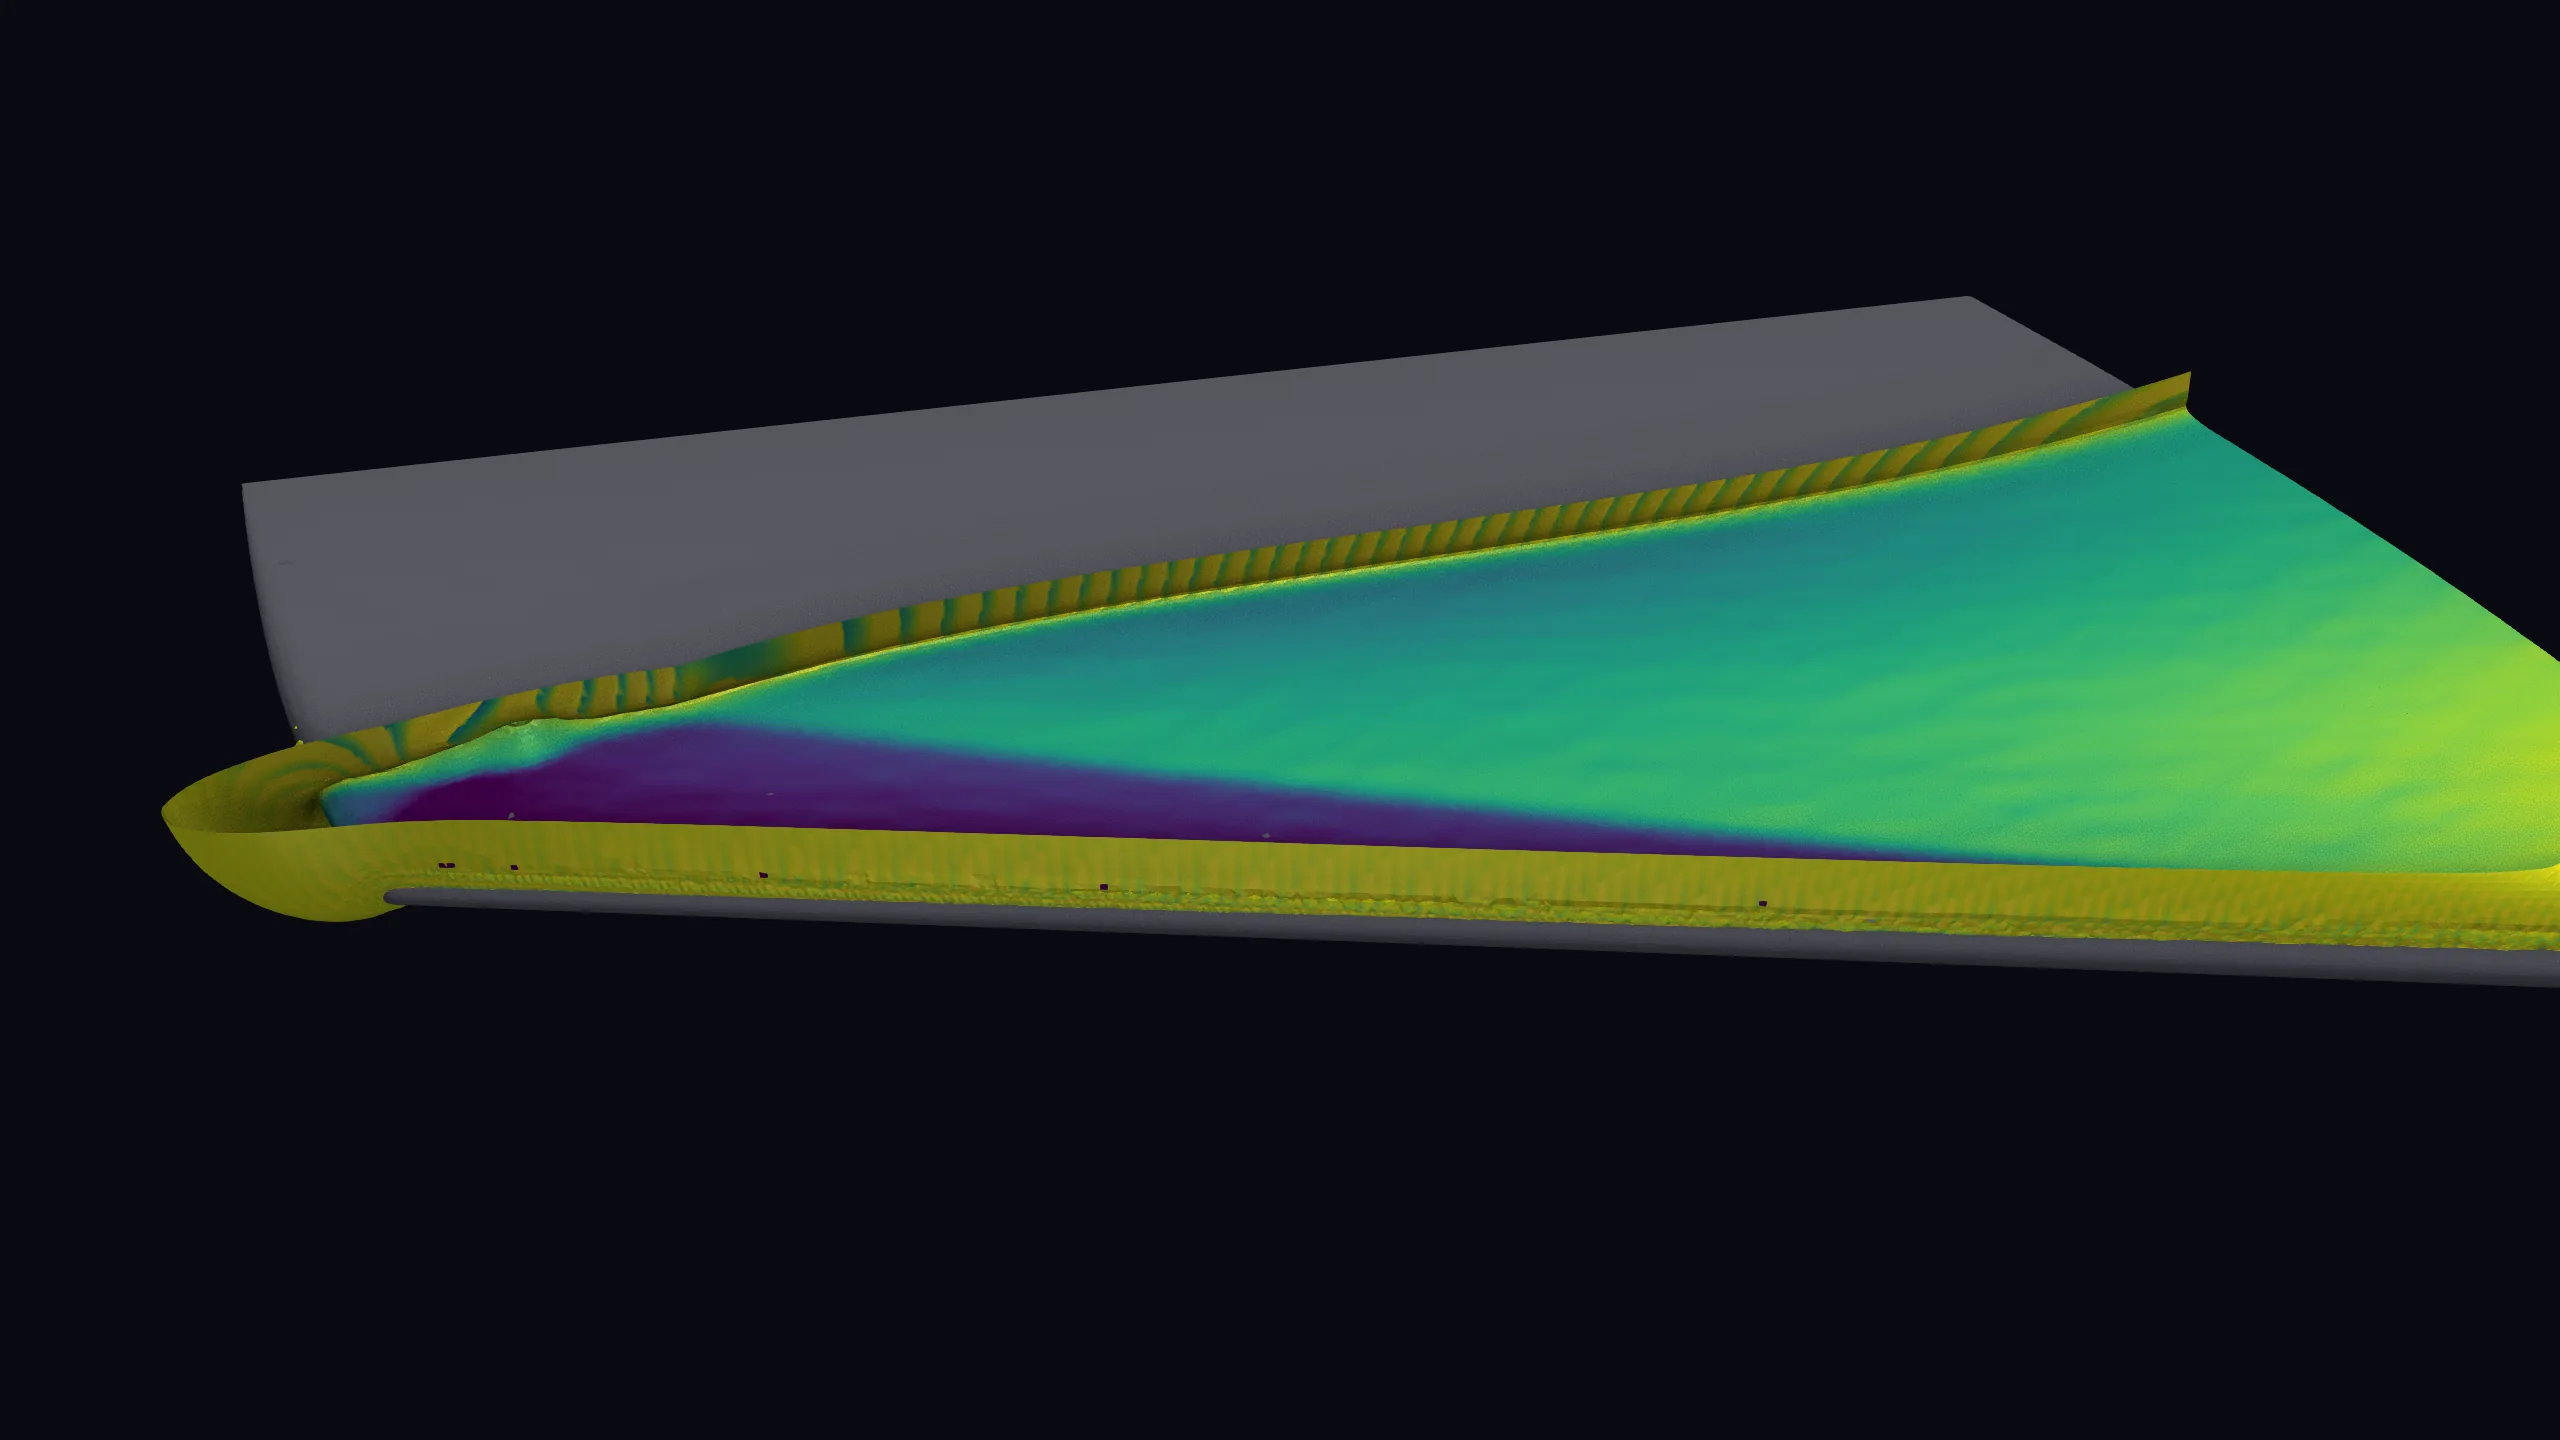
At Mach 0.8395 and 3.06° incidence, the M6 develops a λ-shock on its upper surface: two separate compressions inboard that merge into a single shock toward the tip. Reproducing that topology — not just an integrated coefficient — is what the case is for.
We ran it as steady RANS with the Spalart–Allmaras model, using a density-based solver with an AUSM+up flux and a van Leer limiter. That choice matters here: the compression stays inside about three cells instead of smearing across ten, and a smeared shock defeats the point of the benchmark. One grid, one solve, no tuning against the answer.
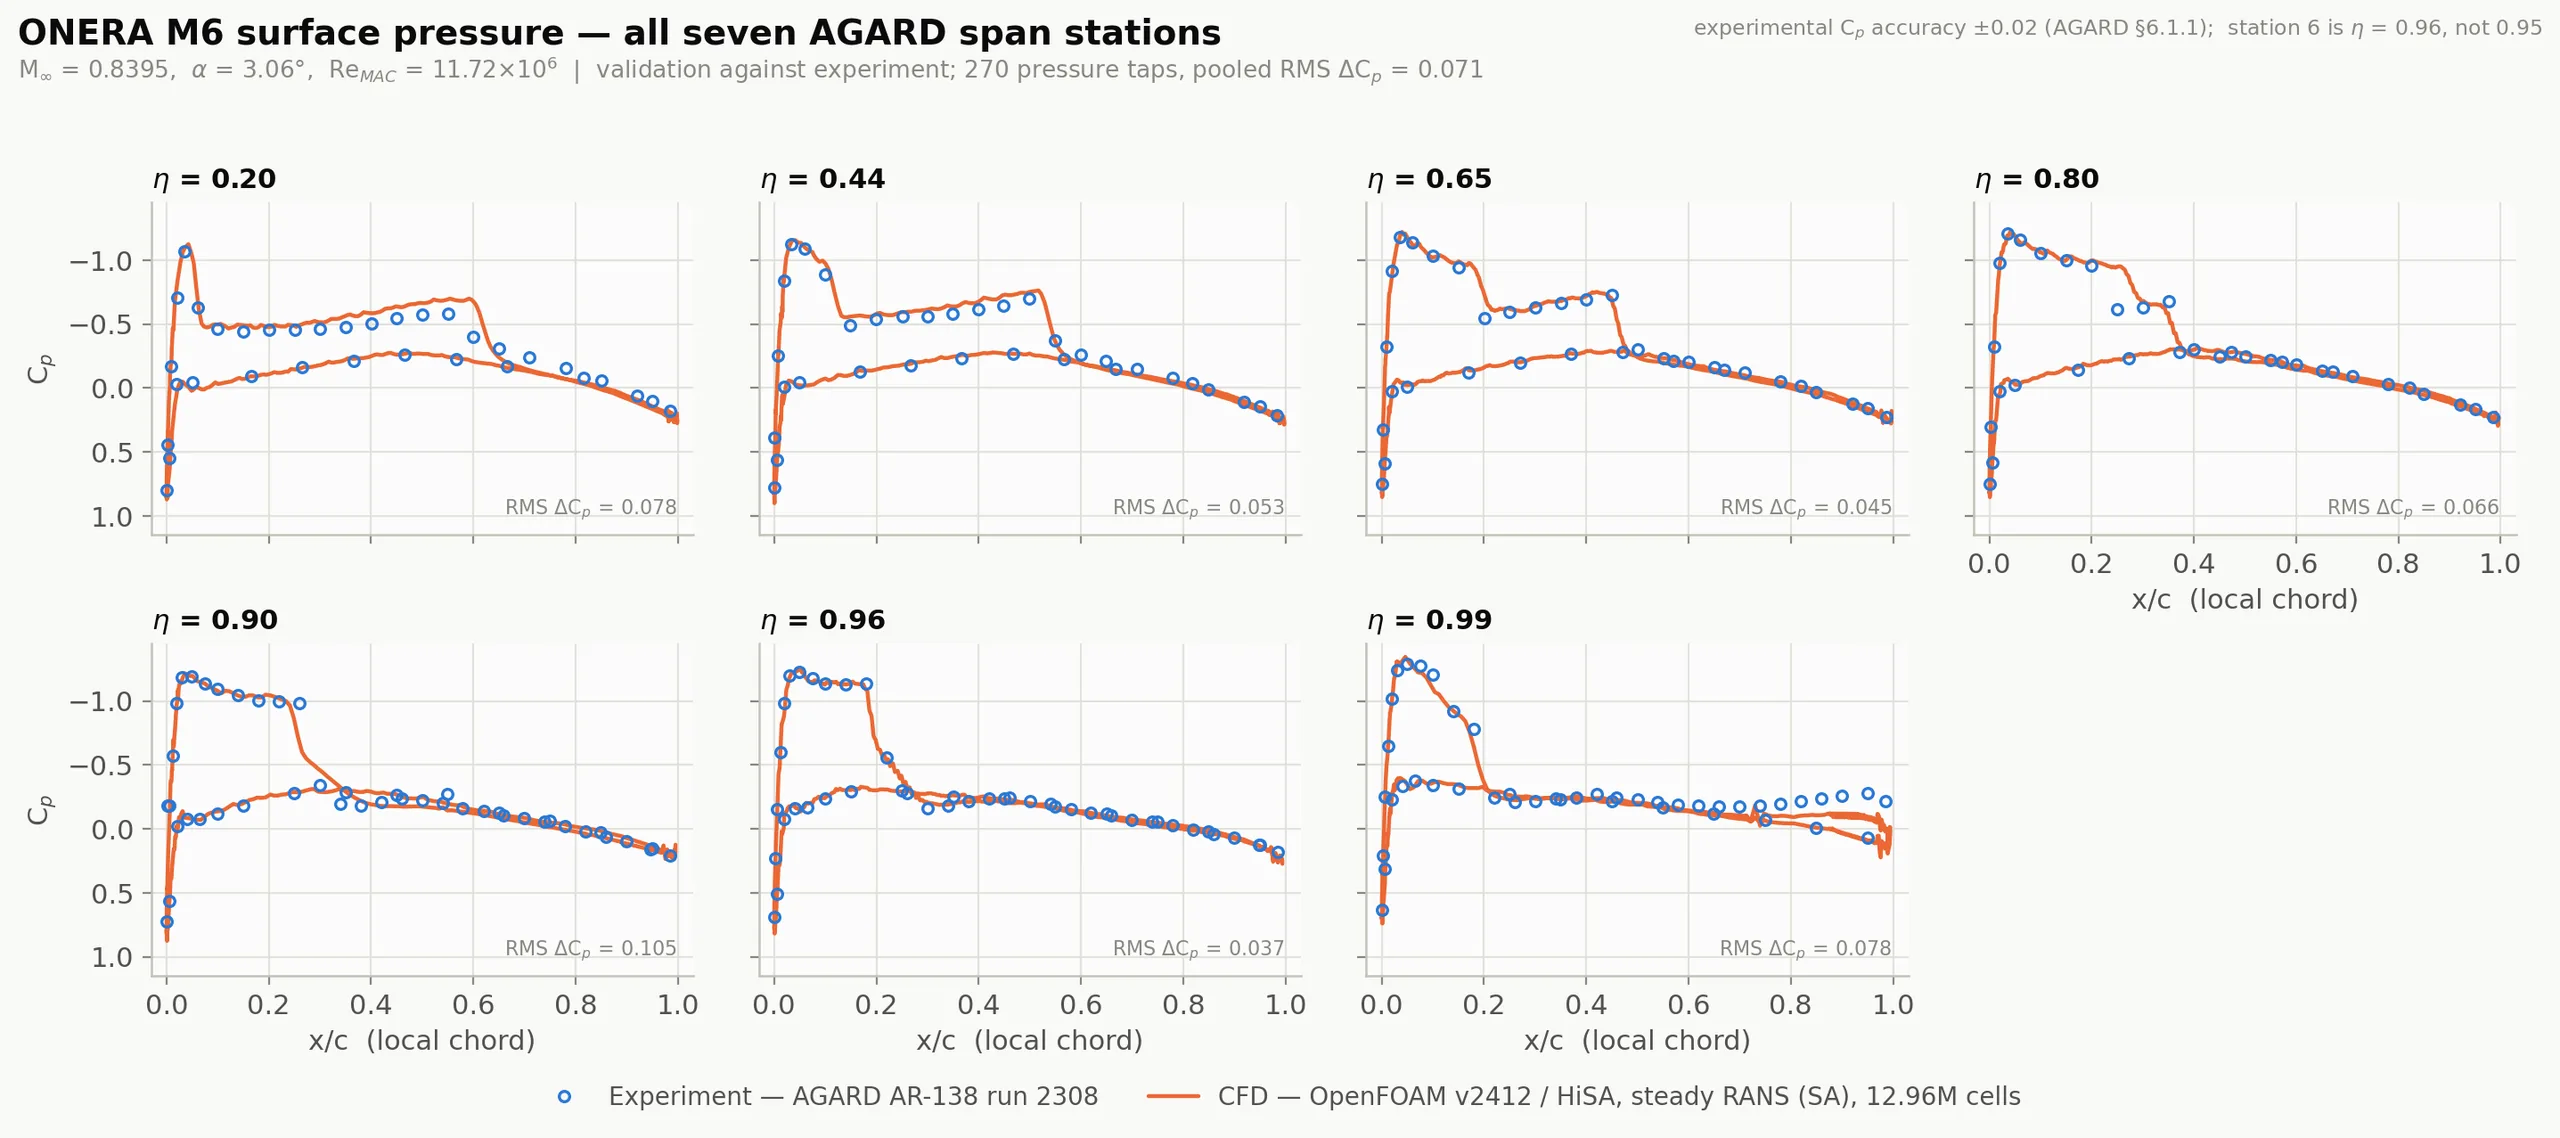
All 270 taps, all seven stations, on one page.
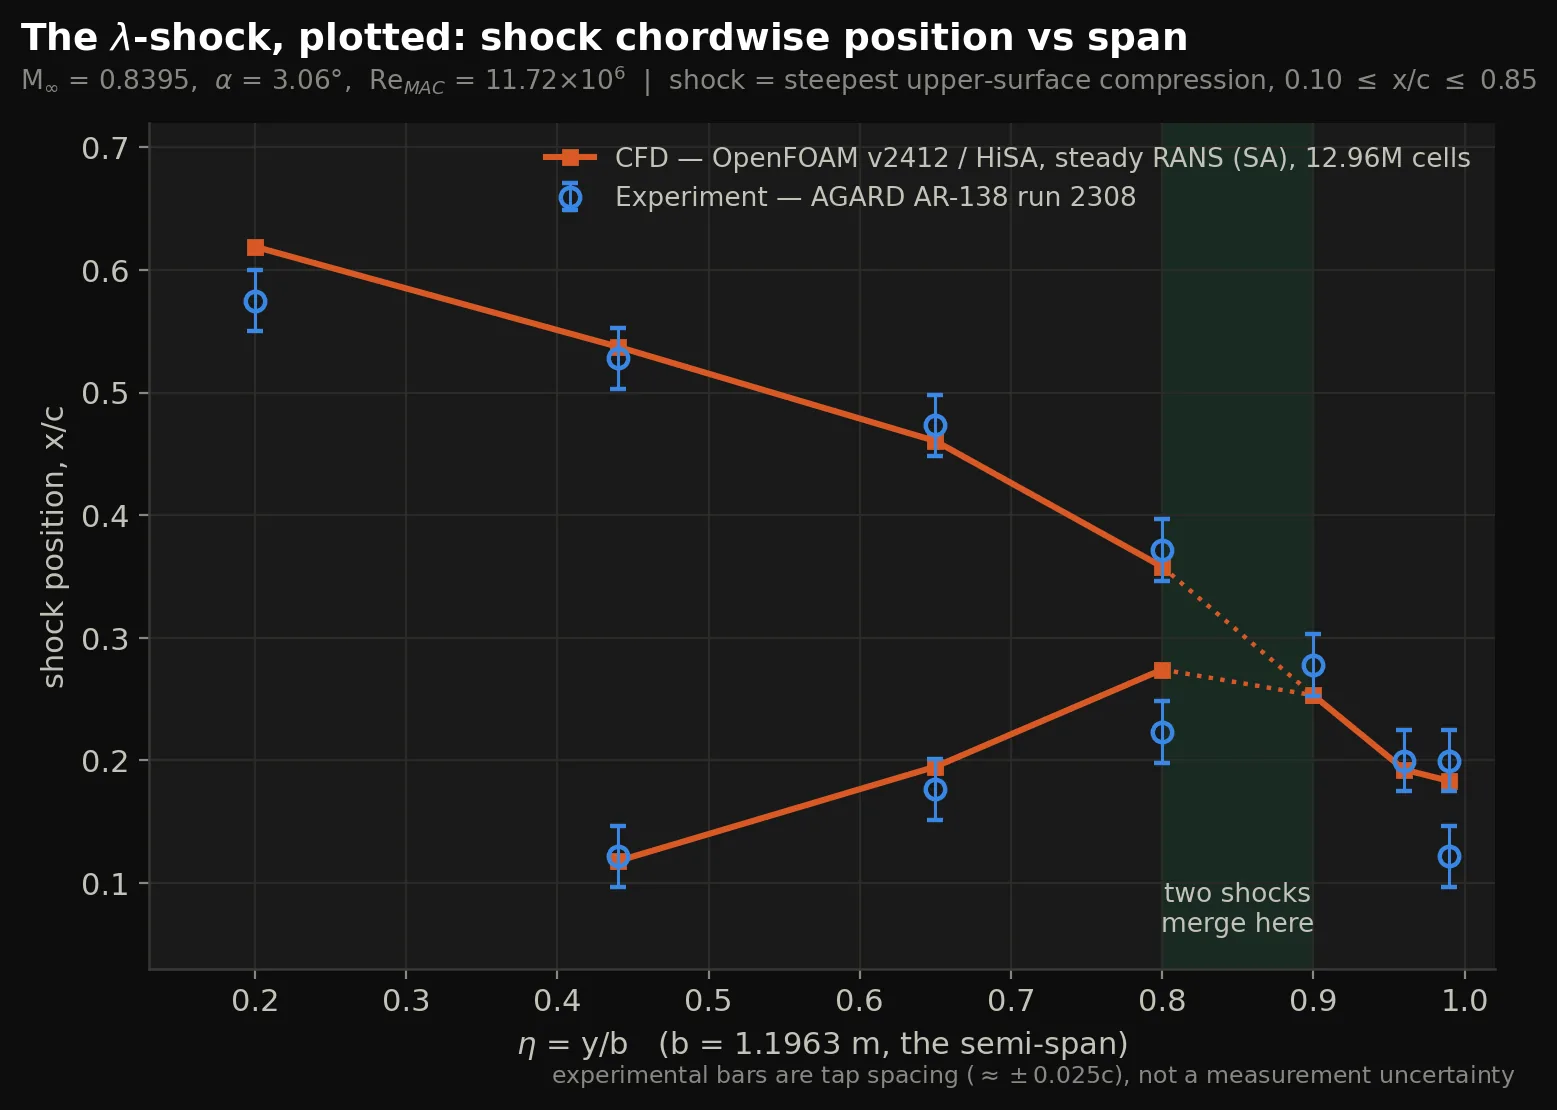
THE HEADLINE
Two shocks inboard, one outboard, merging in the right place.
Two distinct compressions exist at η = 0.44, 0.65 and 0.80 in both the experiment and the simulation, and both collapse to a single shock by η = 0.90. The merge therefore happens between η = 0.80 and η = 0.90 — consistent with NASA's independent choice of η = 0.80 as the shock-intersection station, and with ONERA's own description of two shocks merging on this run.
At four of the seven stations the shock sits within the experiment's own tap spacing. Topology is harder to get than a single number, and it carries to the next wing.
FORCES · VS FIVE SOLUTIONS FROM FOUR CODES
Within a few percent of codes running up to 28× the grid.
The M6 database is surface pressures only, so lift and drag are measured against NASA's reference study — five solutions from four codes — rather than against a tunnel. Four of the five ran 61–363 M cells at the converged end of a refinement study. We ran 12.96 M, wall-modeled, once.
LIFT · CL
−1.14%
0.26718 vs 0.26932 – 0.27120
DRAG · CD
+3.24%
0.01755 vs 0.01695 – 0.01705
DRAG, VISCOUS · CDv
+1.1%
0.005327 vs 0.005232 – 0.005309
PITCHING MOMENT · CMy
1.6% less nose-down
−0.18770 vs −0.19187 – −0.18976
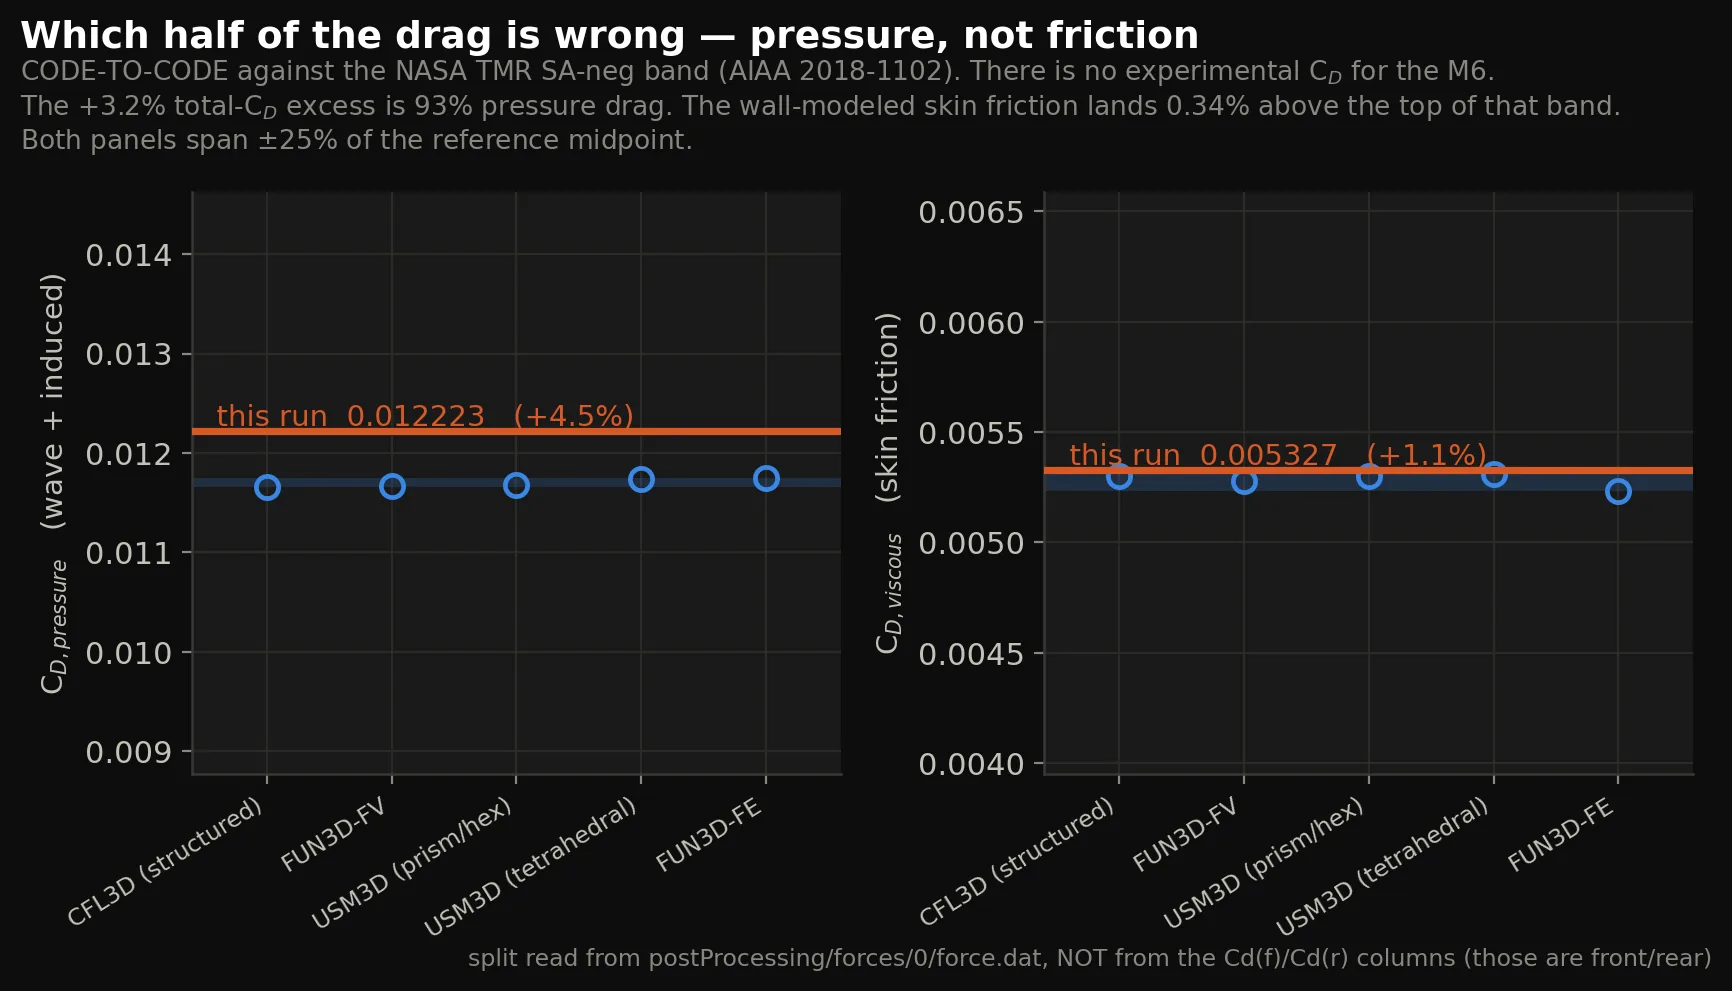
Skin friction within a third of a percent of a wall-resolved band, at a mean y⁺ of 30.
We decomposed our own drag rather than reporting a total. The viscous part — the component a wall-modeled mesh is supposed to get wrong — lands 0.34% above the top of the wall-resolved band and 1.1% from its midpoint, against a band 1.5% wide. The boundary layer's momentum is being modeled correctly.
THE PHYSICS, ACROSS THE SPAN
The supersonic pocket, shrinking root to tip.
Mach number at the seven validation stations, one color map and one physical scale on every panel. The two-lobed structure inboard is the λ; by η = 0.90 it is a single shock.
WHY WE PUBLISH THIS
We publish the benchmark so you can check us.
The AGARD tap data is public and the NASA reference study is published. Every comparison here is labeled for what it is — validation against experiment for surface pressure, code-to-code for the forces — so you can check the claim against the same sources we used.
READ THE FULL WRITE-UPBRING US THE HARD CASE
Transonic, separated, or just expensive to mesh.
If your program needs aerodynamic numbers someone will have to defend in a design review, send us the geometry and the operating point. We'll tell you what we can resolve, what we can't, and what the answer is worth.
OpenFOAM v2412 with HiSA, steady RANS (Spalart–Allmaras), M∞ = 0.8395, α = 3.06°, Re_MAC = 11.72×10⁶, 12,962,287 cells, 3000 iterations. Experimental reference: AGARD AR-138 (1979) run 2308, surface pressure only — the database contains no force data, so CL, CD and CMy are compared code-to-code against the NASA Turbulence Modeling Resource SA-neg study (AIAA 2018-1102), not against measurement.