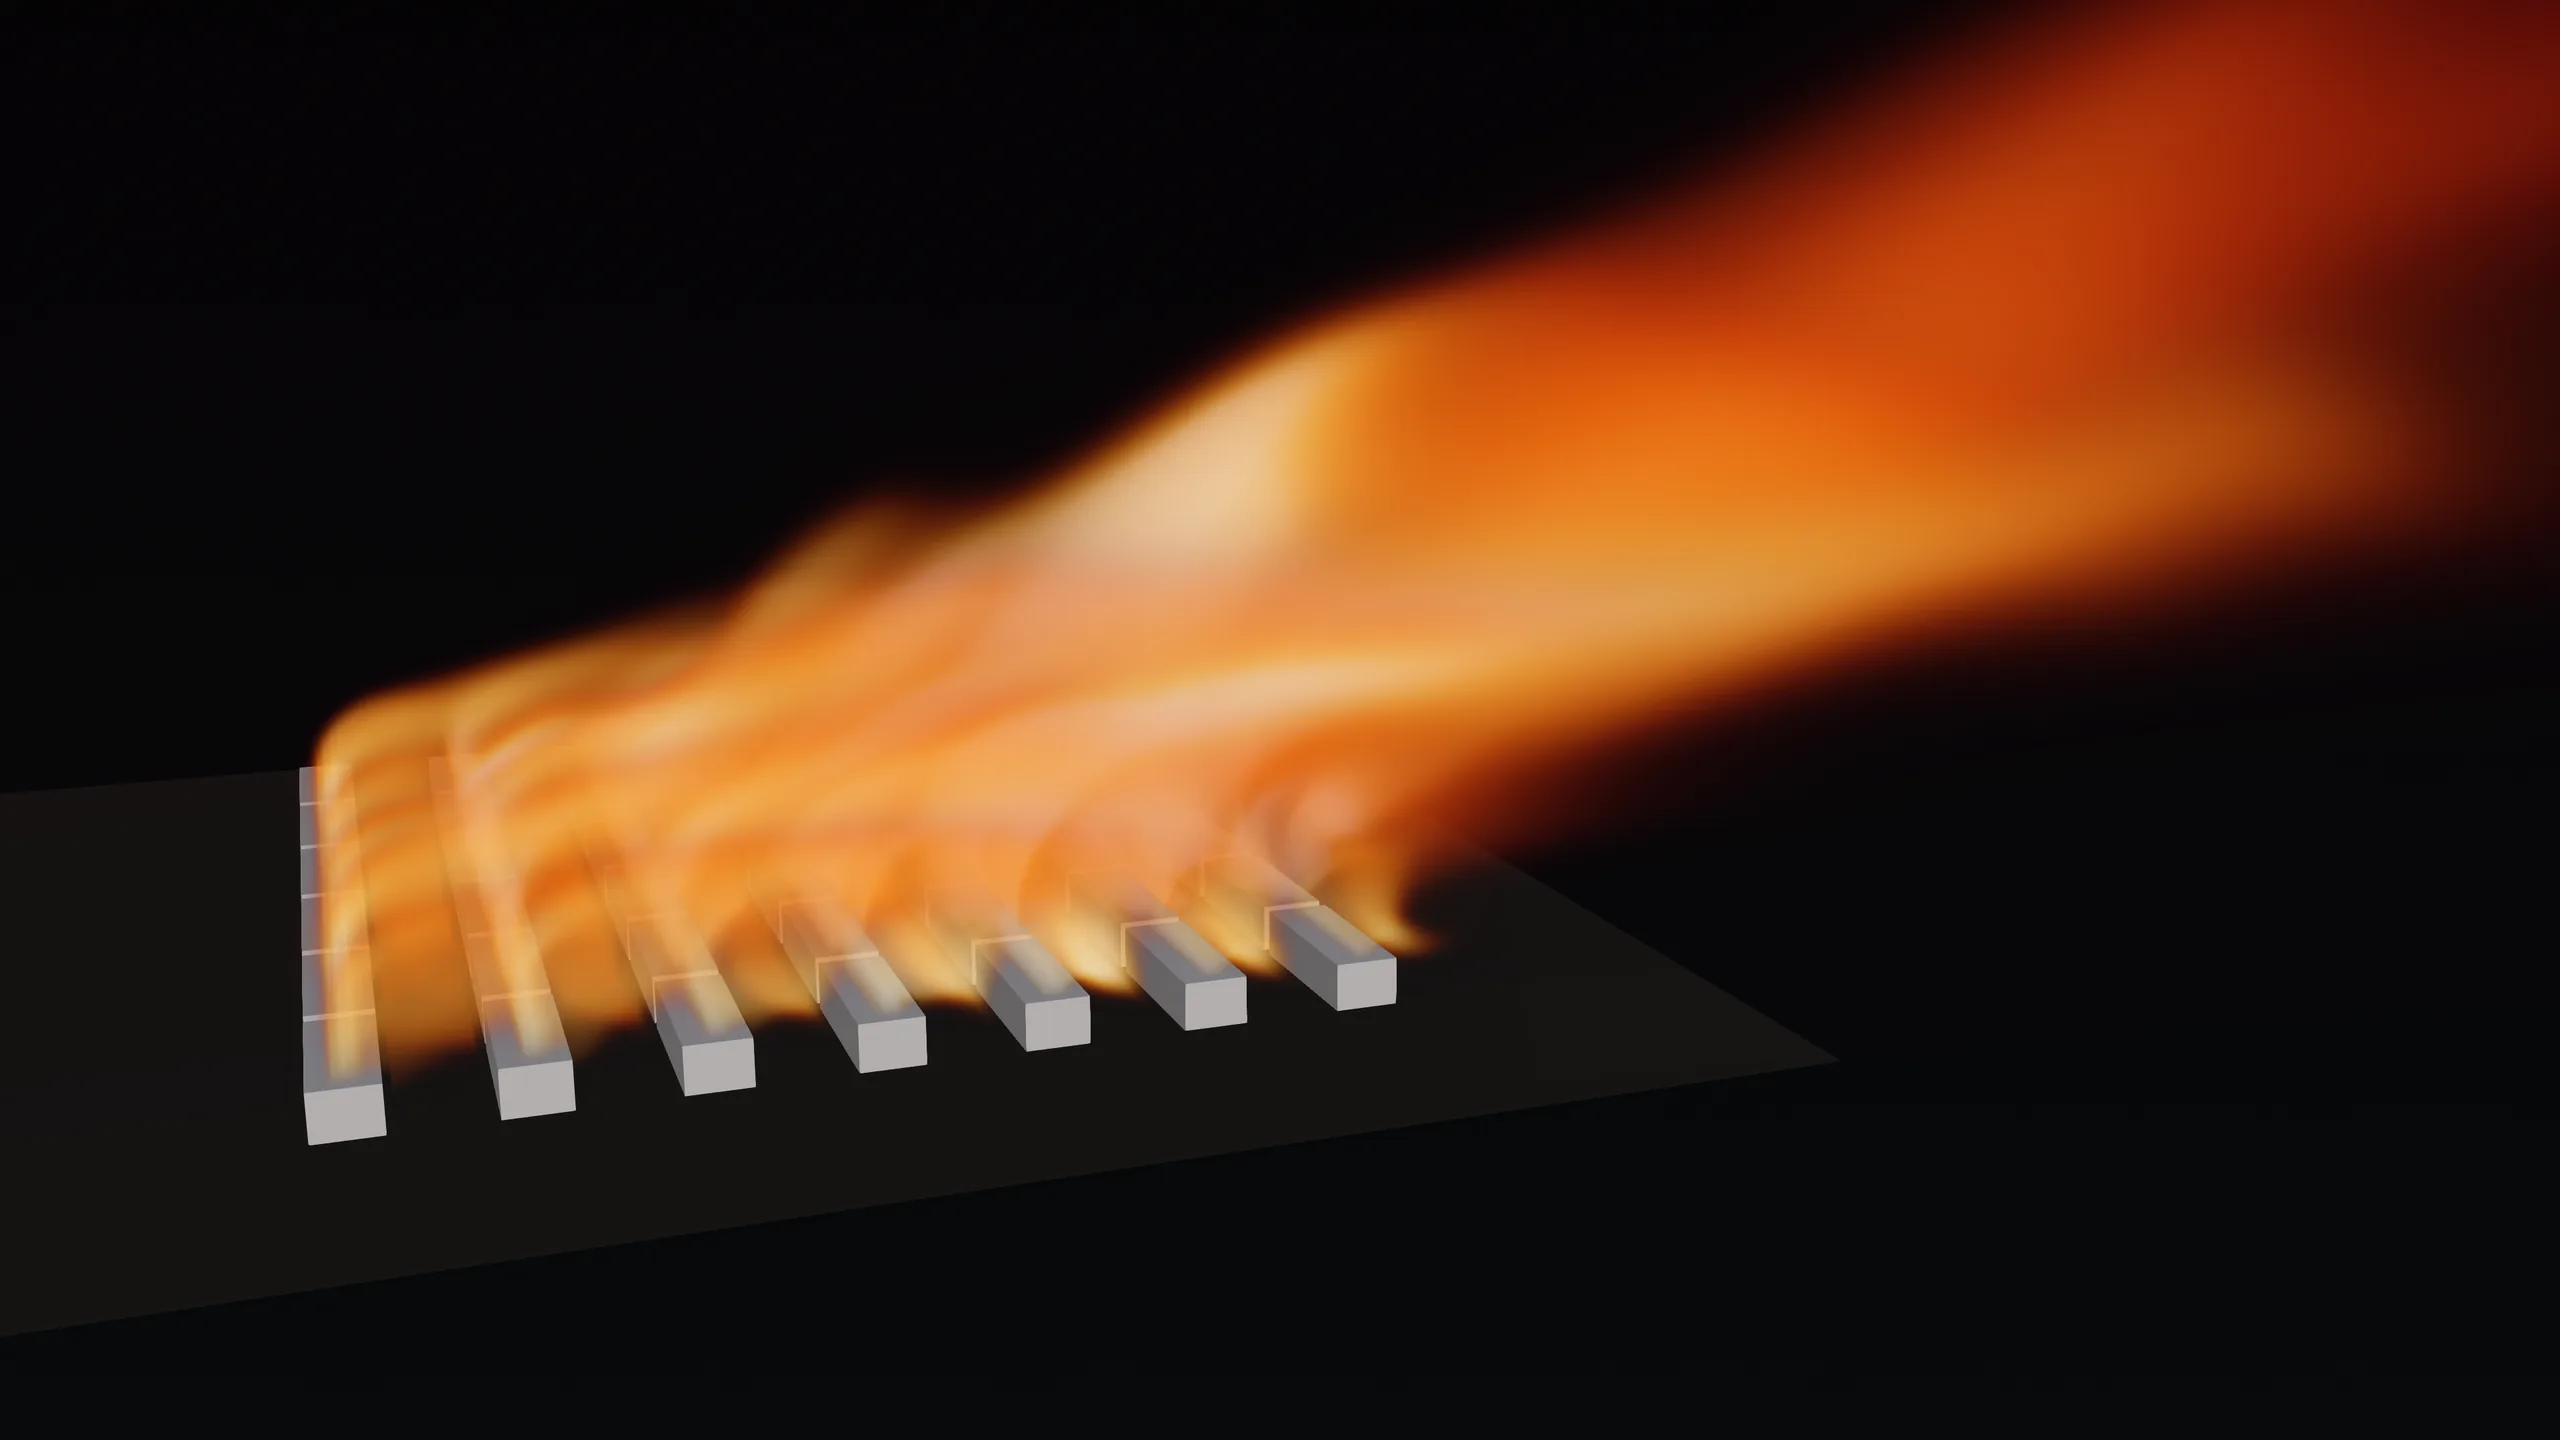
How much cooling capacity does your layout cost you?
We used CFD to compare four ways of arranging 42 dry coolers around a 44 MW-class data hall. The dense baseline quietly lost about 12% of its cooling capacity to its own exhaust. A better layout cut that penalty to about 5%.
56.3 MW
HEAT REJECTED
42
DRY COOLERS
9 MIN
AGENT SETUP · ALL FOUR LAYOUTS
5 DAYS
FROM DATA-COMPLETE TO DECISION
No customer commissioned this study. We built it on our own bench so you can see the method and check the assumptions — every one of them is listed on this page, including the one that carries the headline: an assumed 2% per kelvin capacity derate.
THE DECISION
The cheapest layout on paper was not the cheapest layout to operate.
On a hot, low-wind day, air-cooled units can start breathing their neighbors' discharge. Entering air gets warmer, condensing capacity falls, and the site pays twice: once for the compact layout and again in derated IT load or extra machines.
The obvious fixes all spend something different. Wider aisles spend land downwind. Split banks spend parcel width. Rooftop placement spends structure and piping. The real question is which layout protects capacity against the constraint your site actually has.
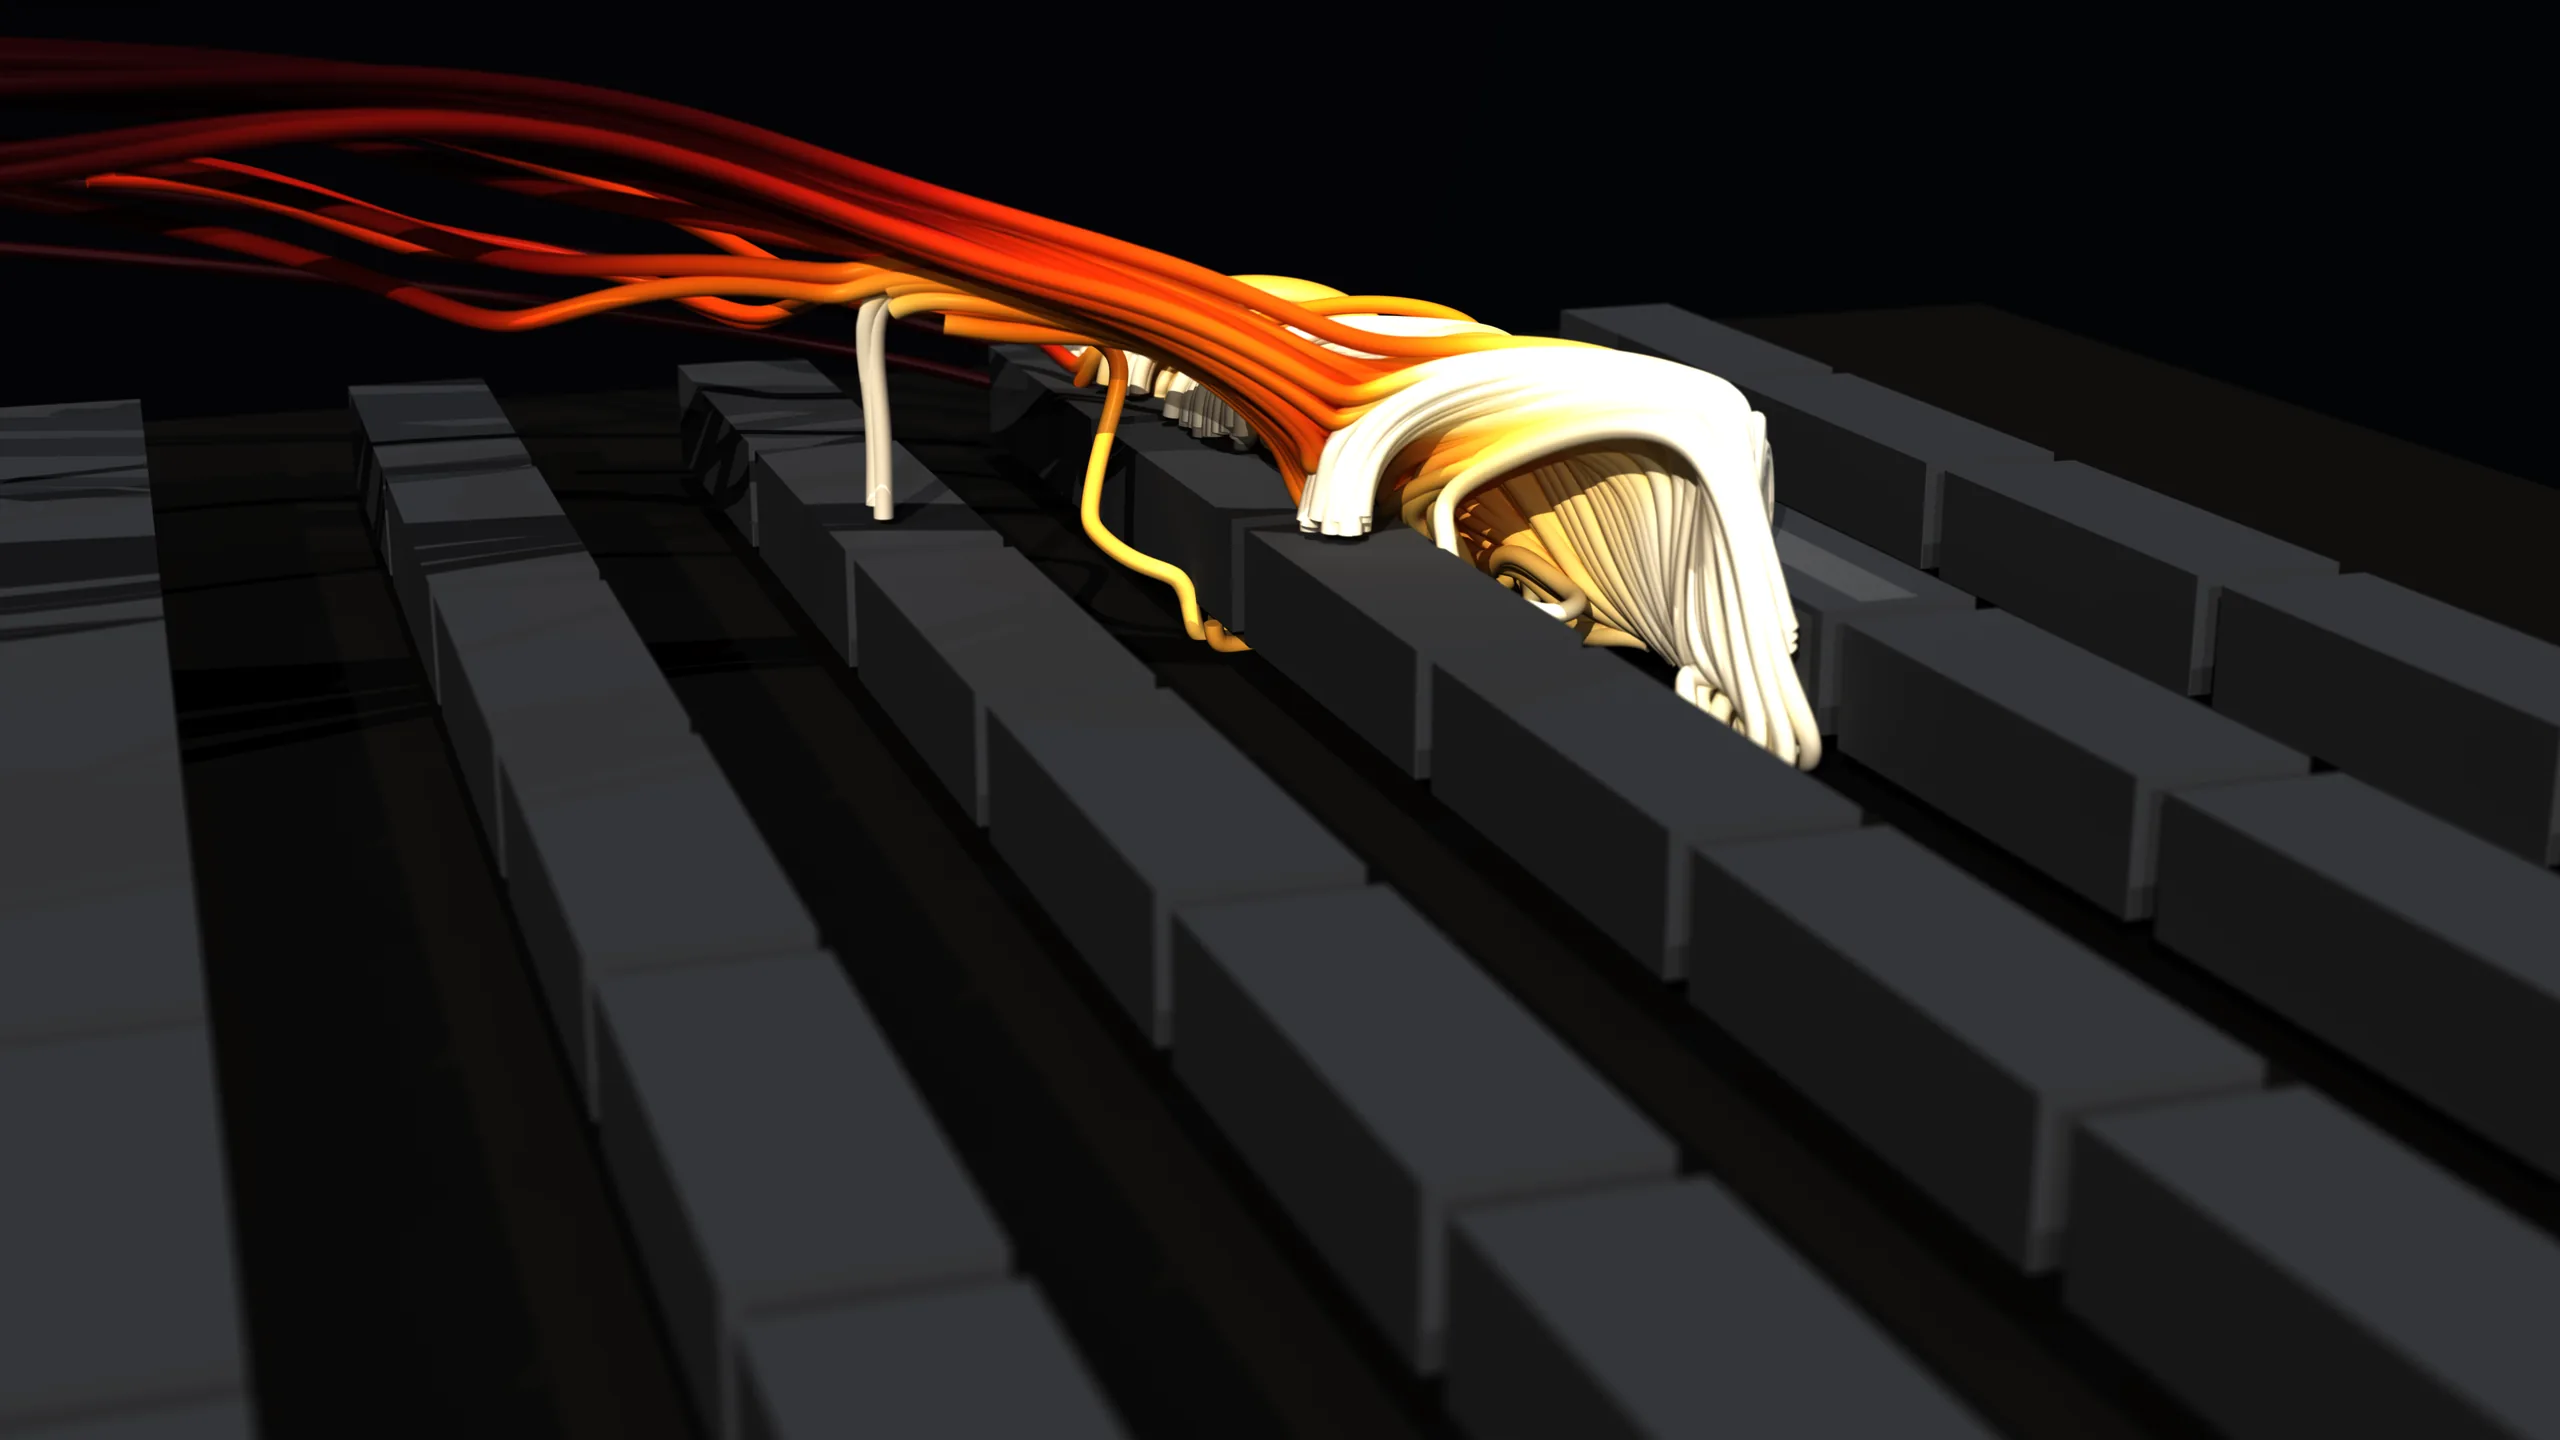
Pathlines traced backward from one intake. They do not come from upwind — they come off the machine in front.
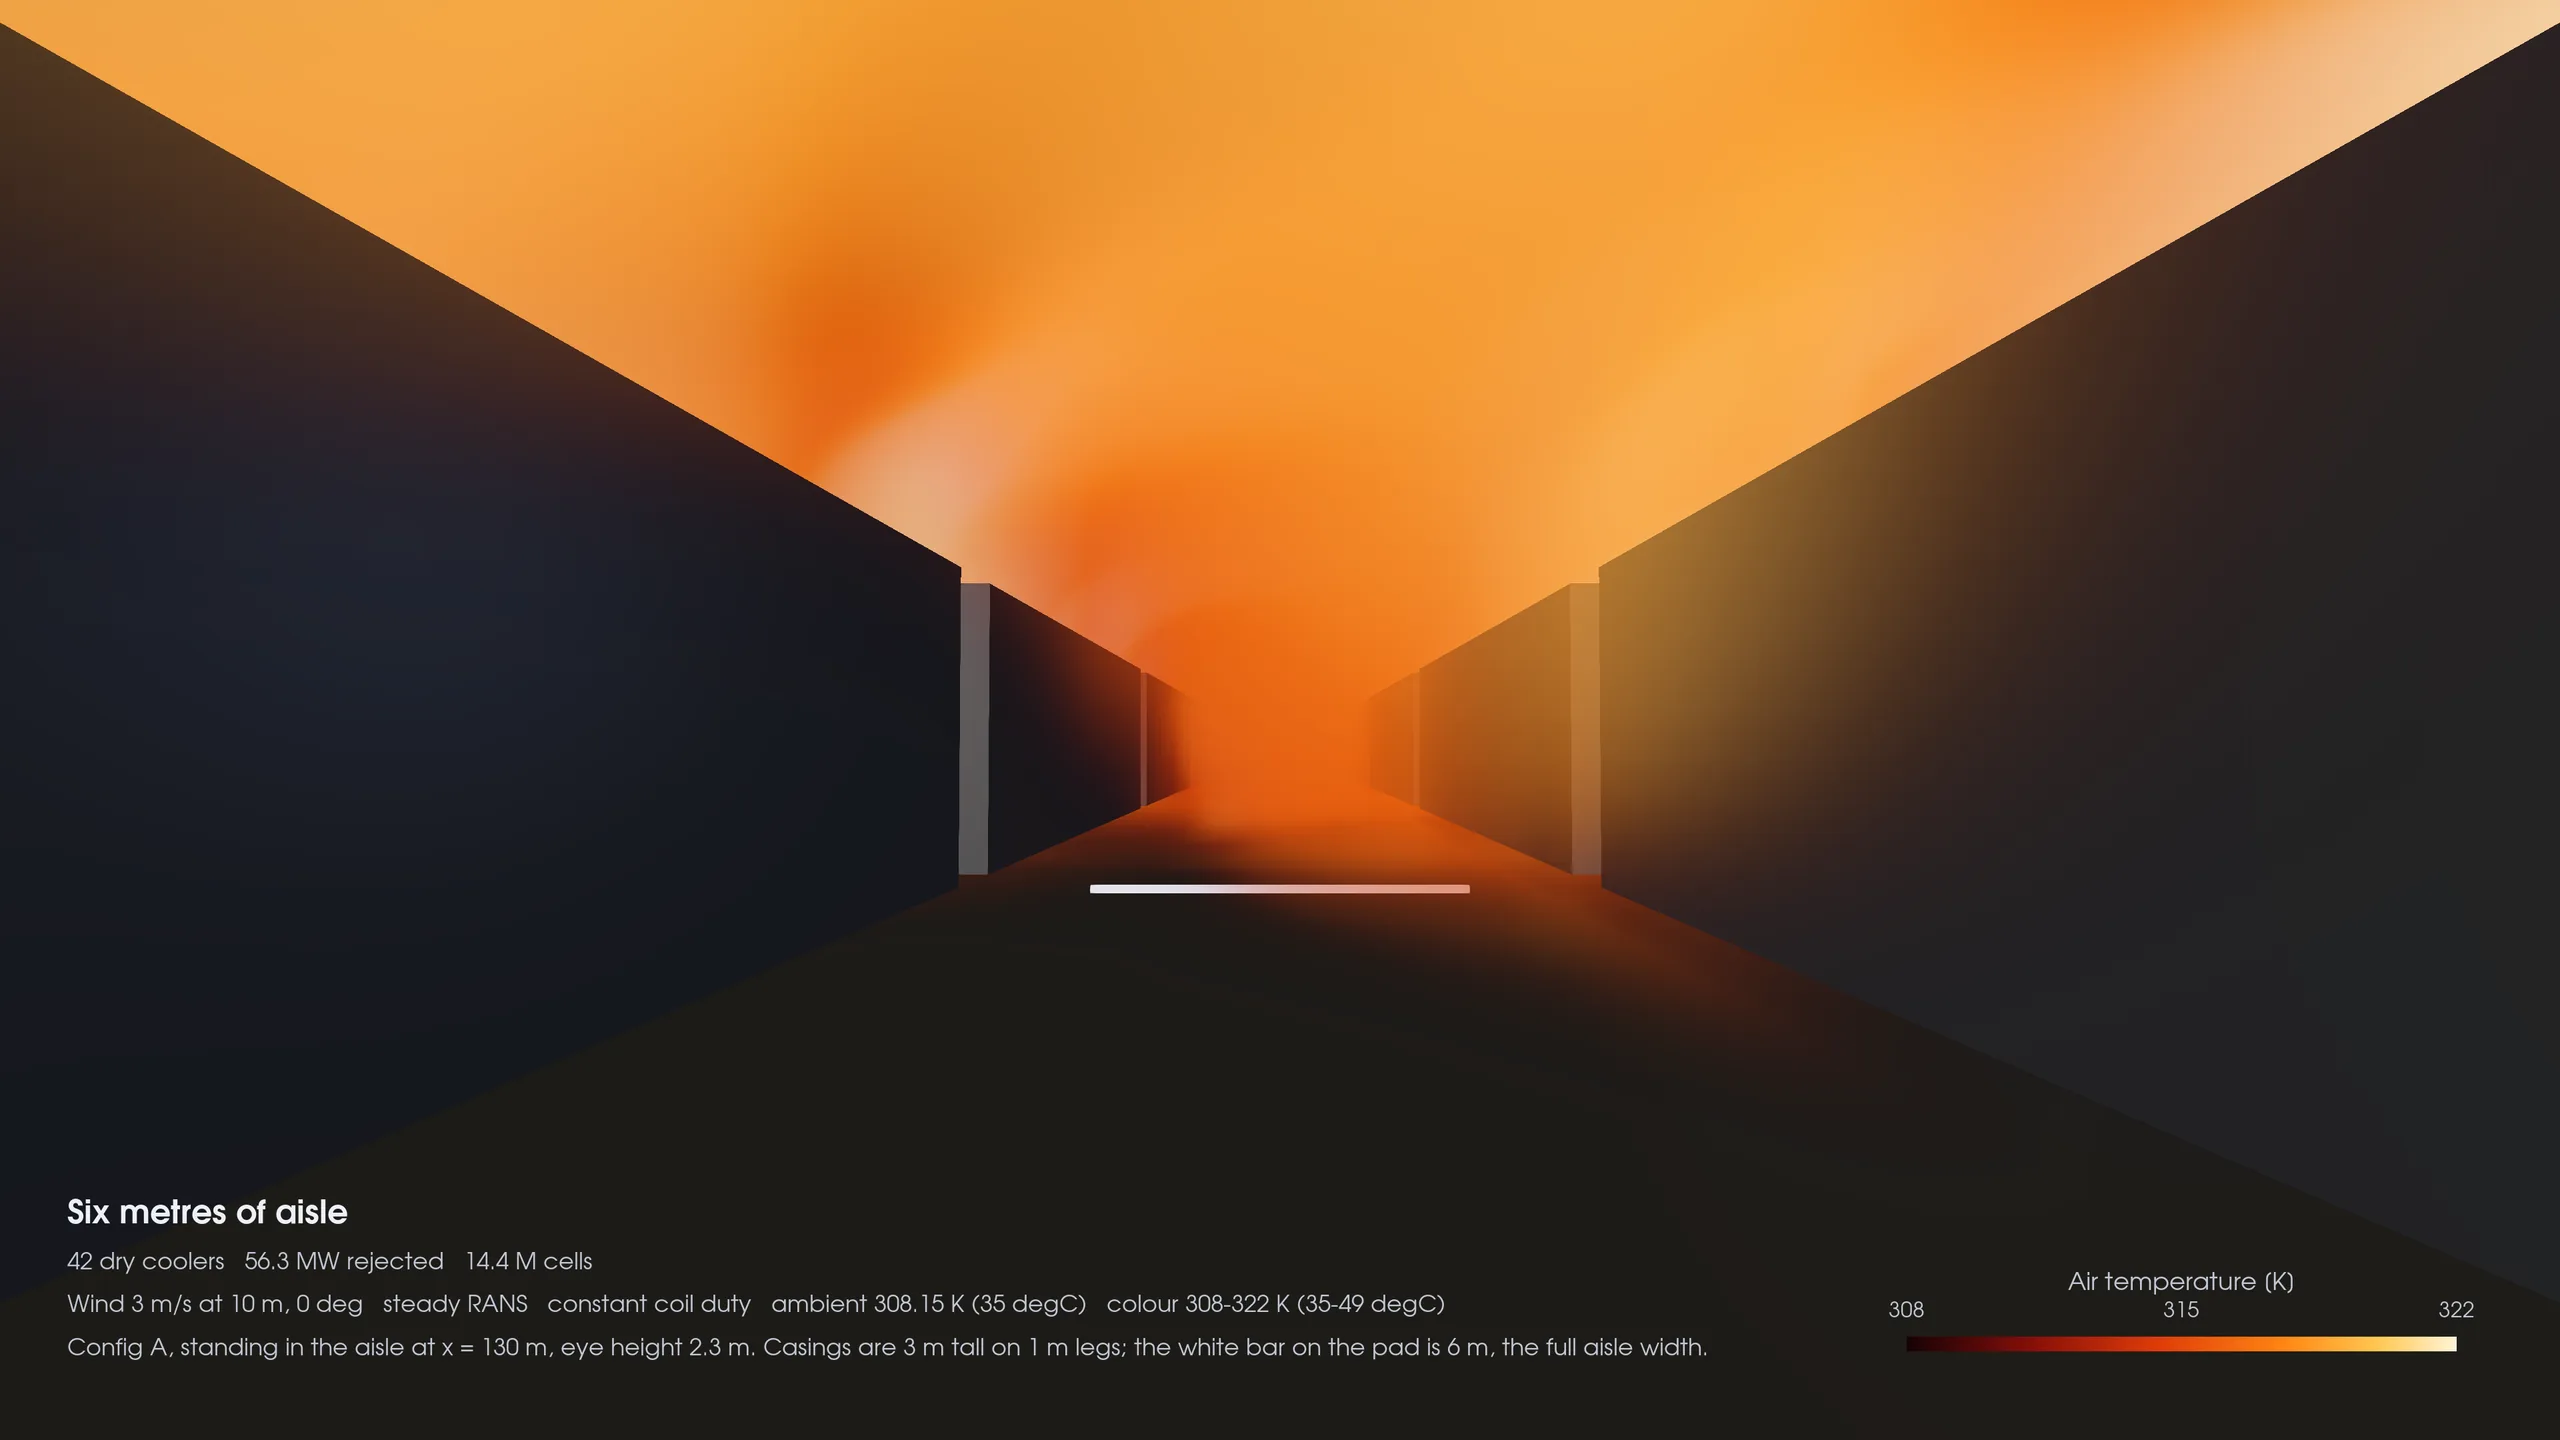
Standing in a 6 m aisle of the dense baseline. The air the next row is about to breathe is the ceiling above you.
WHAT WORKING WITH US LOOKS LIKE
A five-day path from geometry to a design decision.
This was an independent representative study, not customer work. The schedule below shows how we would structure the same problem as a focused service engagement. Exact timing depends on geometry quality, case count, and compute requirements.
DAY 0
Frame the decision
You bring geometry, duty schedule, fan curves, site weather, and your operating limits. We turn “will these coolers recirculate?” into the decision that actually matters: which layout protects capacity without spending land in the wrong direction. The clock starts when that data is complete, not at first contact.
Signed-off simulation brief
DAY 1
Build and challenge the baseline
Our agents prepare the geometry, boundary conditions, mesh controls, and run configuration. An engineer checks the physical model before compute starts. The first baseline exists to find bad assumptions, not to make a pretty picture.
Baseline model + setup review
DAY 2
Return the first readout
We review intake temperatures unit by unit and trace where the hot air is coming from. You get an early call with the dominant mechanism, any data gaps, and the options worth testing. You can redirect the study while it's still cheap to.
Interim readout in 48 hours
DAY 3
Run the useful alternatives
The platform generates controlled variants and launches them in parallel. Here that means wider aisles, rooftop placement, and split flanking banks — with identical hardware, duty, weather, and mesh recipe so the comparison stays honest. Building and meshing three new layouts took under seven minutes of the run.
Four comparable layouts
DAY 4
Try to disprove the result
We check mesh quality, per-unit mass balance, atmospheric profile, convergence, and mesh sensitivity. This pass caught a fan-deck meshing error that ordinary residuals did not. Automation makes the sweep fast; engineering review is what makes it defensible.
Verification record + limitations
DAY 5
Deliver a decision package
You receive the recommendation, the trade space behind it, the solved fields, the verification record, and a short working session with our engineers. You get a recommendation you can defend in a design review, not a folder of contours.
Report, visuals, fields, review
THE RESULT
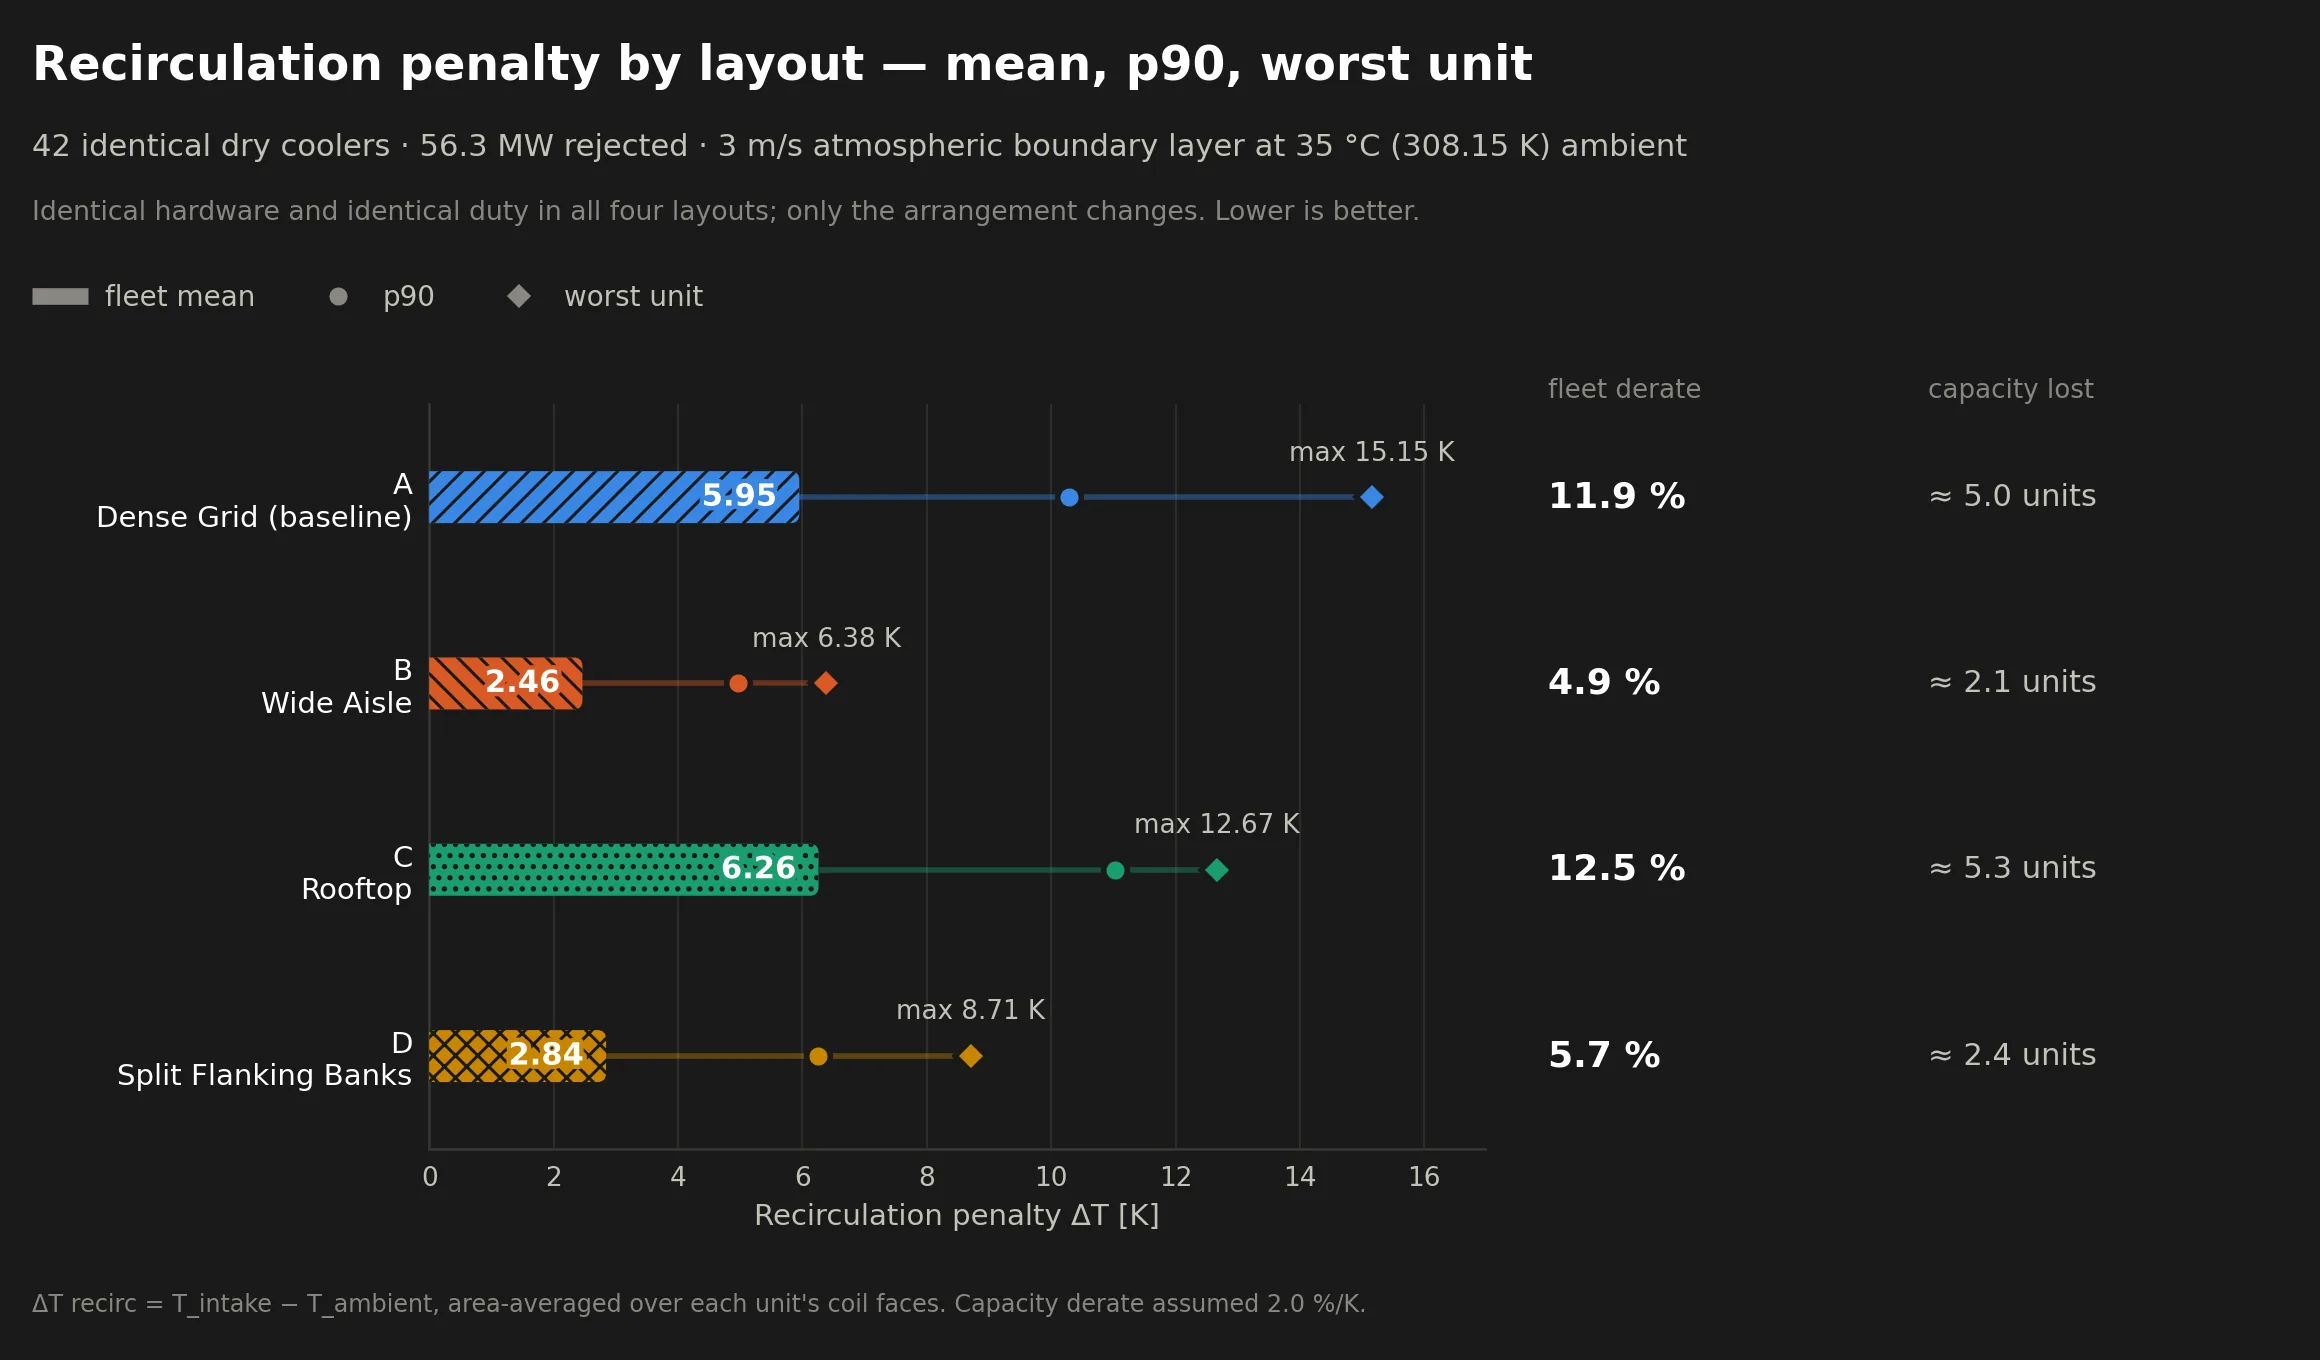
Same machines. Same duty. A different answer.
Widening the aisles reduced mean intake temperature rise by 59%, recovering roughly seven percentage points of fleet capacity under the stated derate assumption.
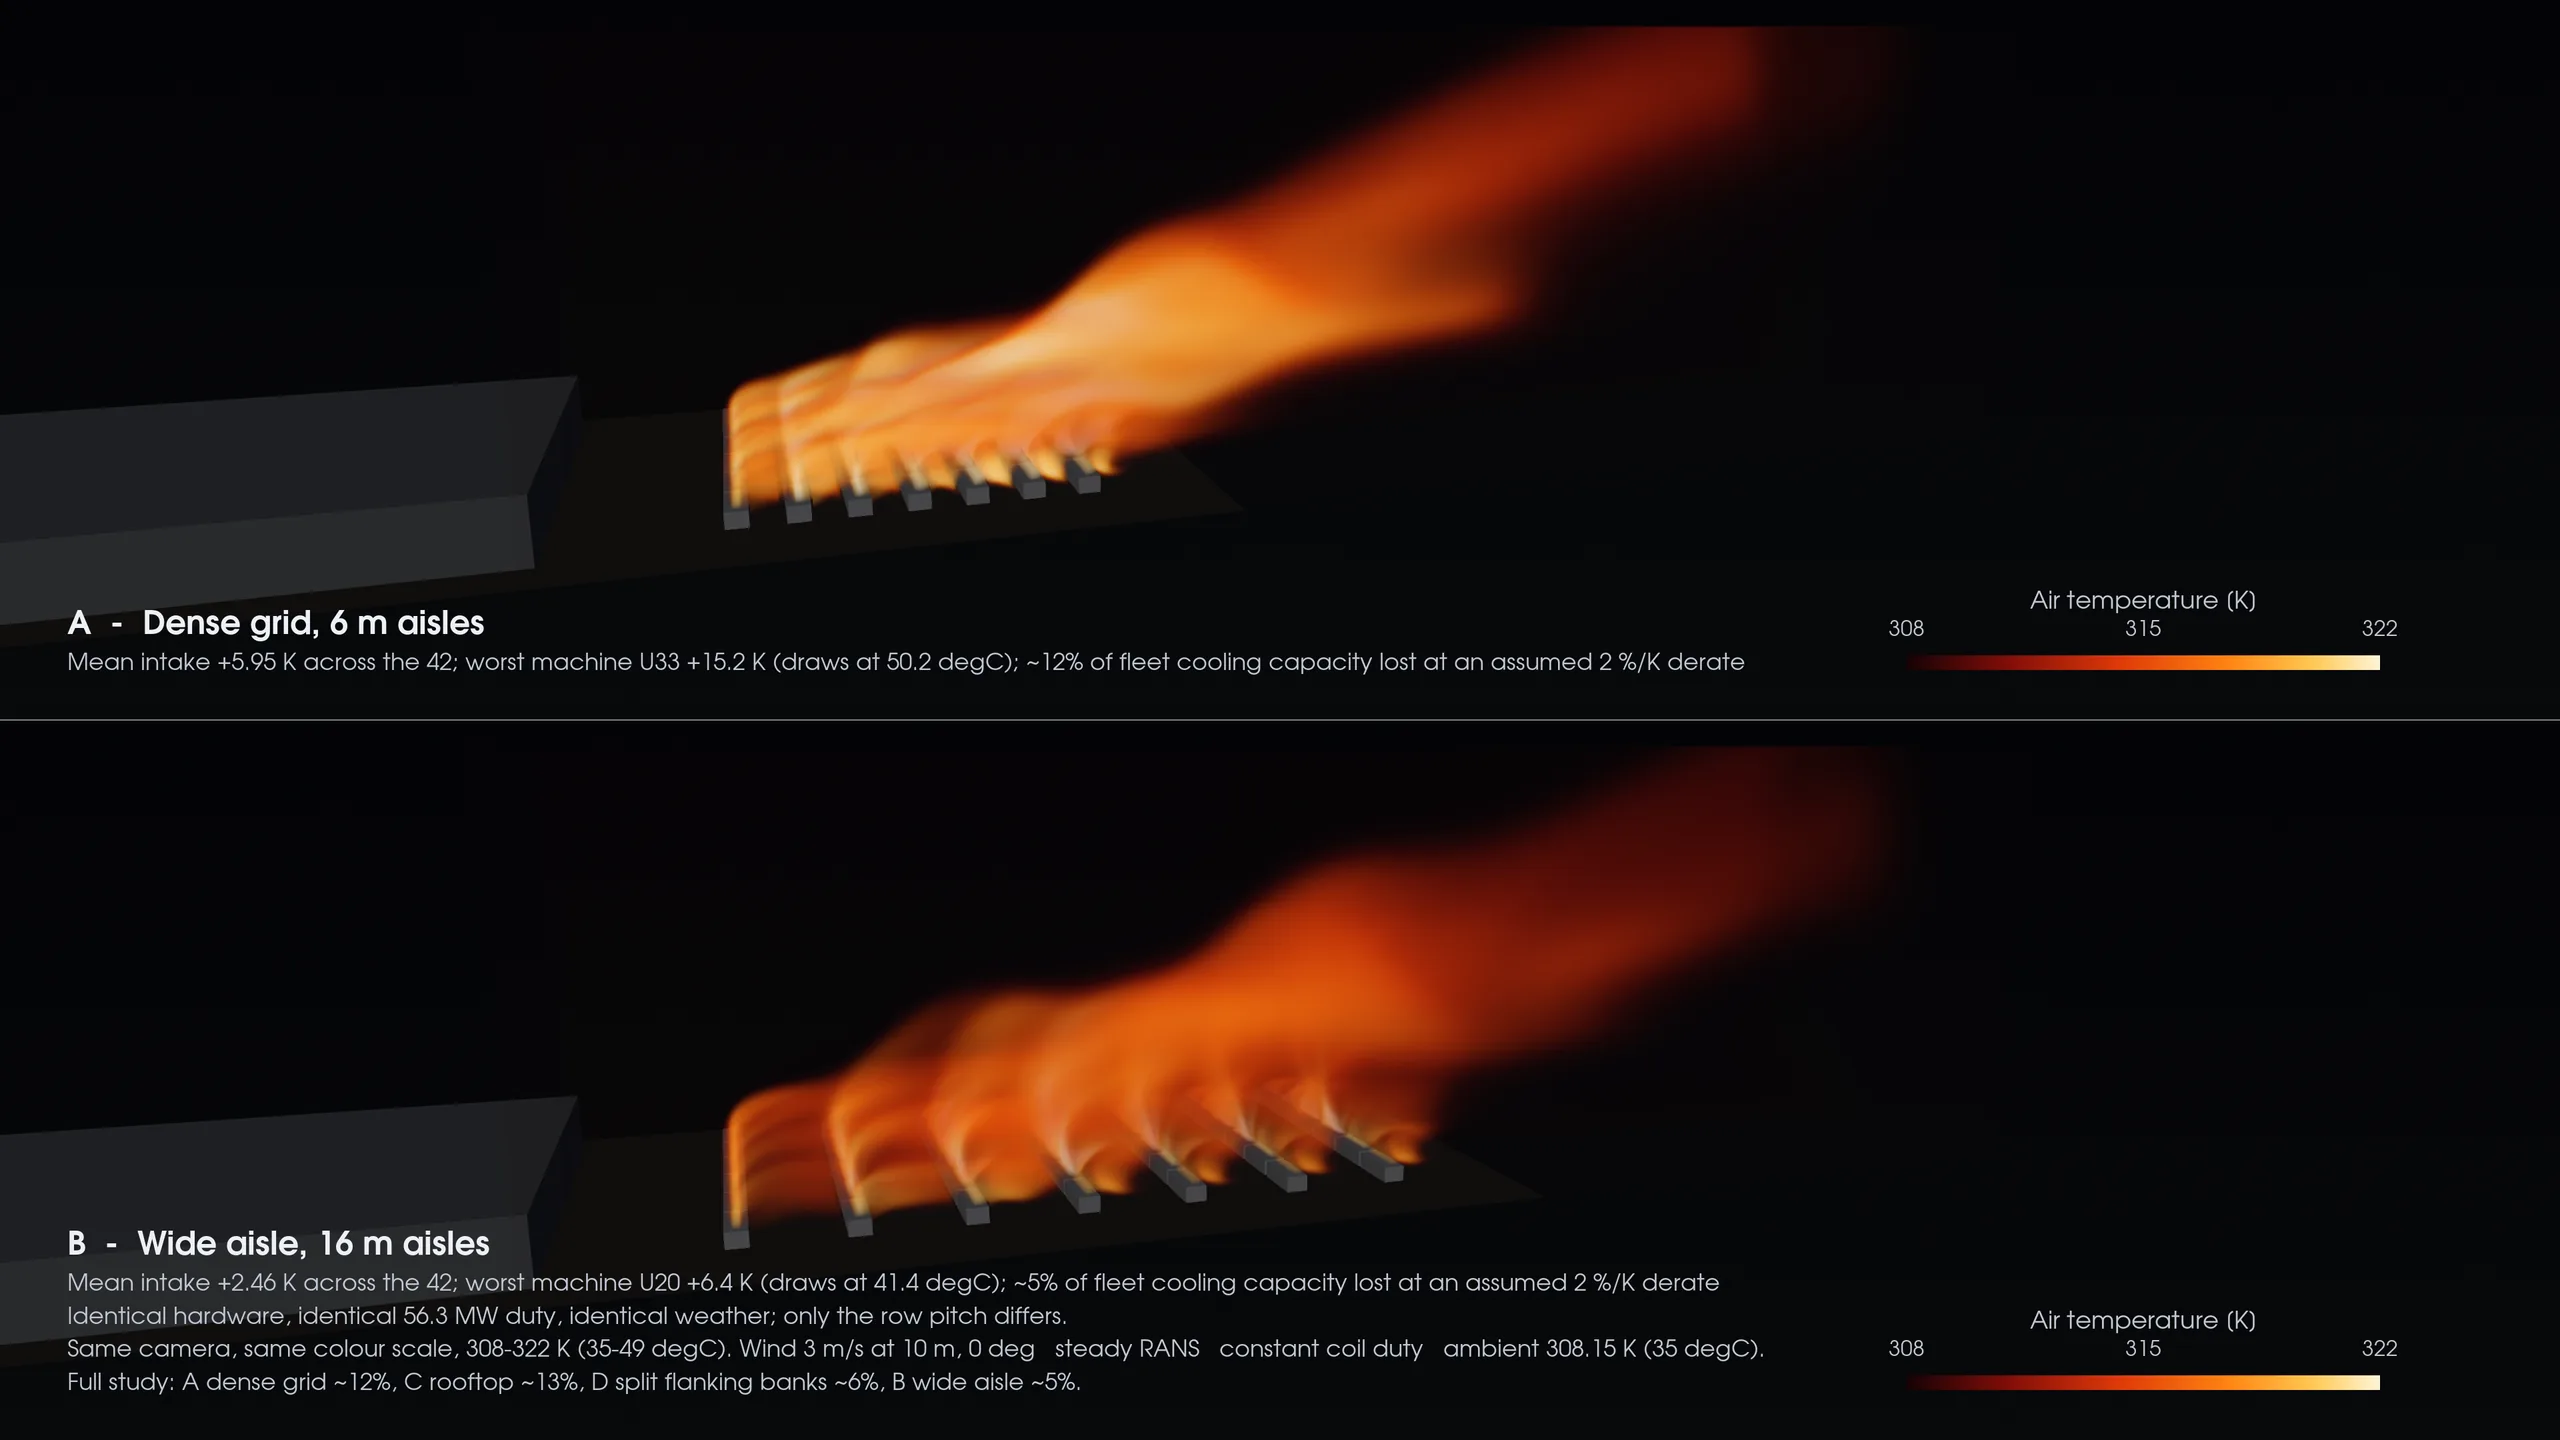
A — DENSE GRID
+5.95 K
Mean intake rise
11.9% fleet derate · worst intake ≈50 °C
B — WIDE AISLE
LOWEST PENALTY+2.46 K
Mean intake rise
4.9% fleet derate · worst intake ≈41 °C
C — ROOFTOP
+6.26 K
Mean intake rise
12.5% fleet derate · not a controlled comparison — 5.2% low on discharge momentum, a dead heat with A
D — SPLIT FLANKING
+2.84 K
Mean intake rise
5.7% fleet derate · trades parcel width for pad area
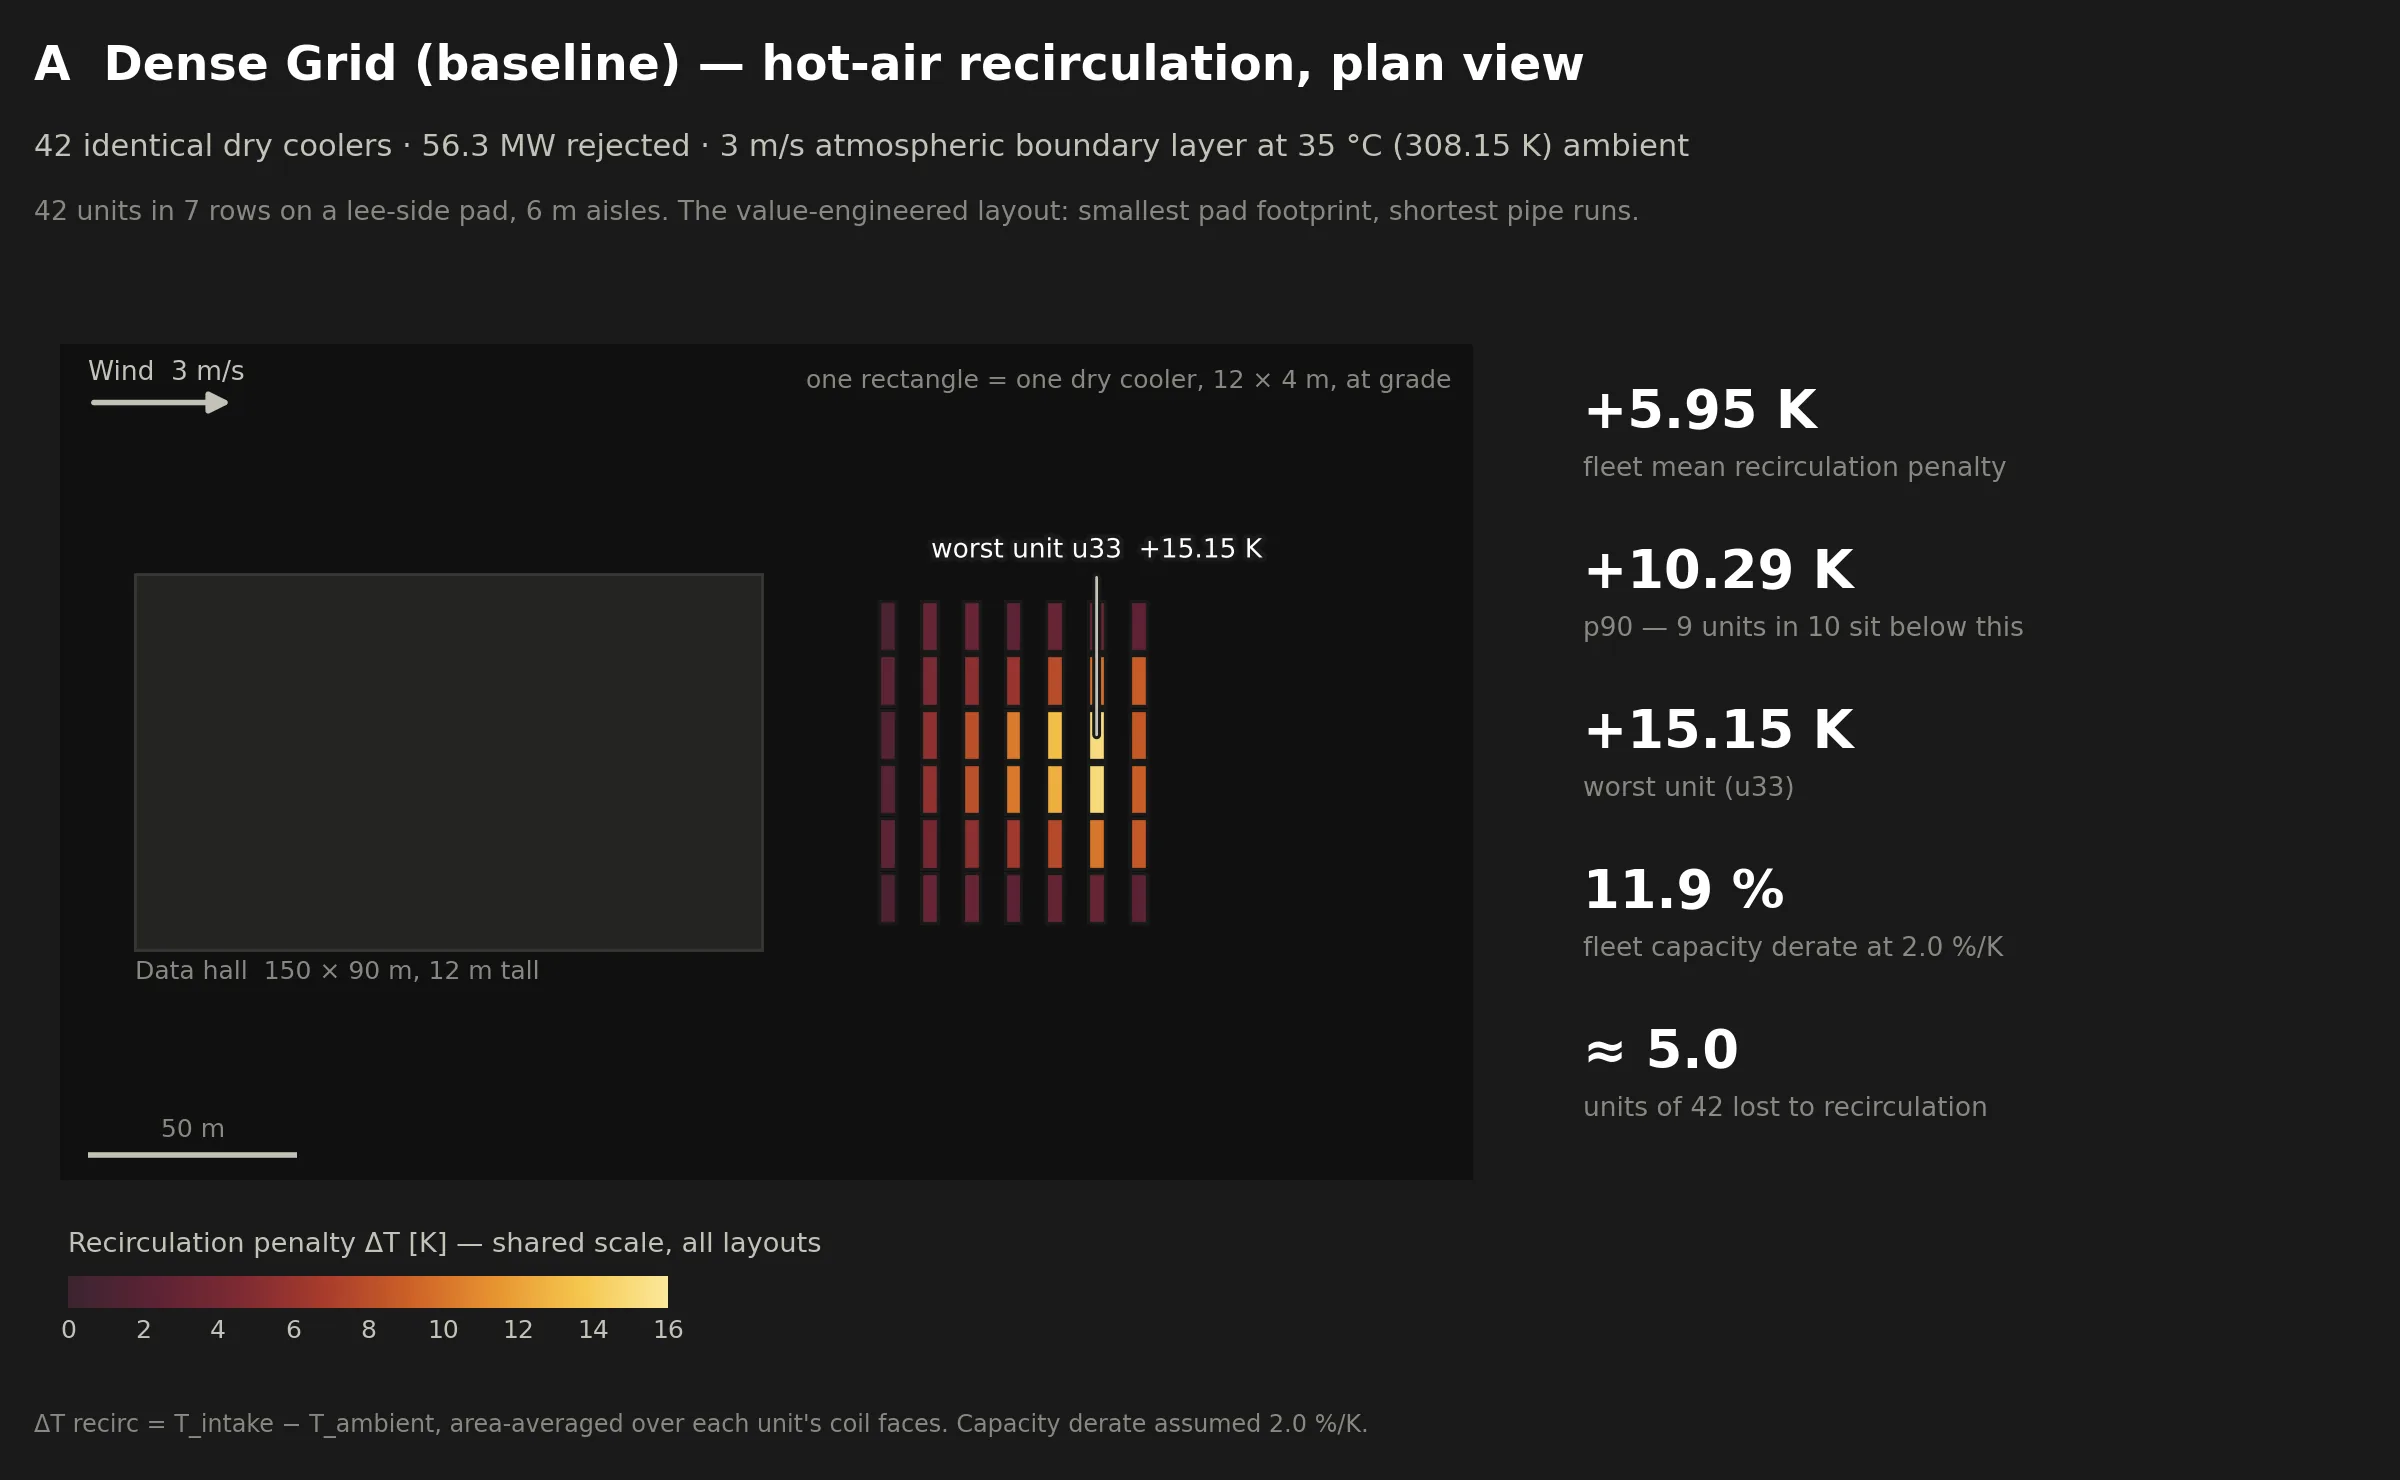
A / DENSE GRID
The penalty accumulates through the packed array. The worst unit reaches +15.2 ± 1.3 K above ambient — about 50 °C entering air.
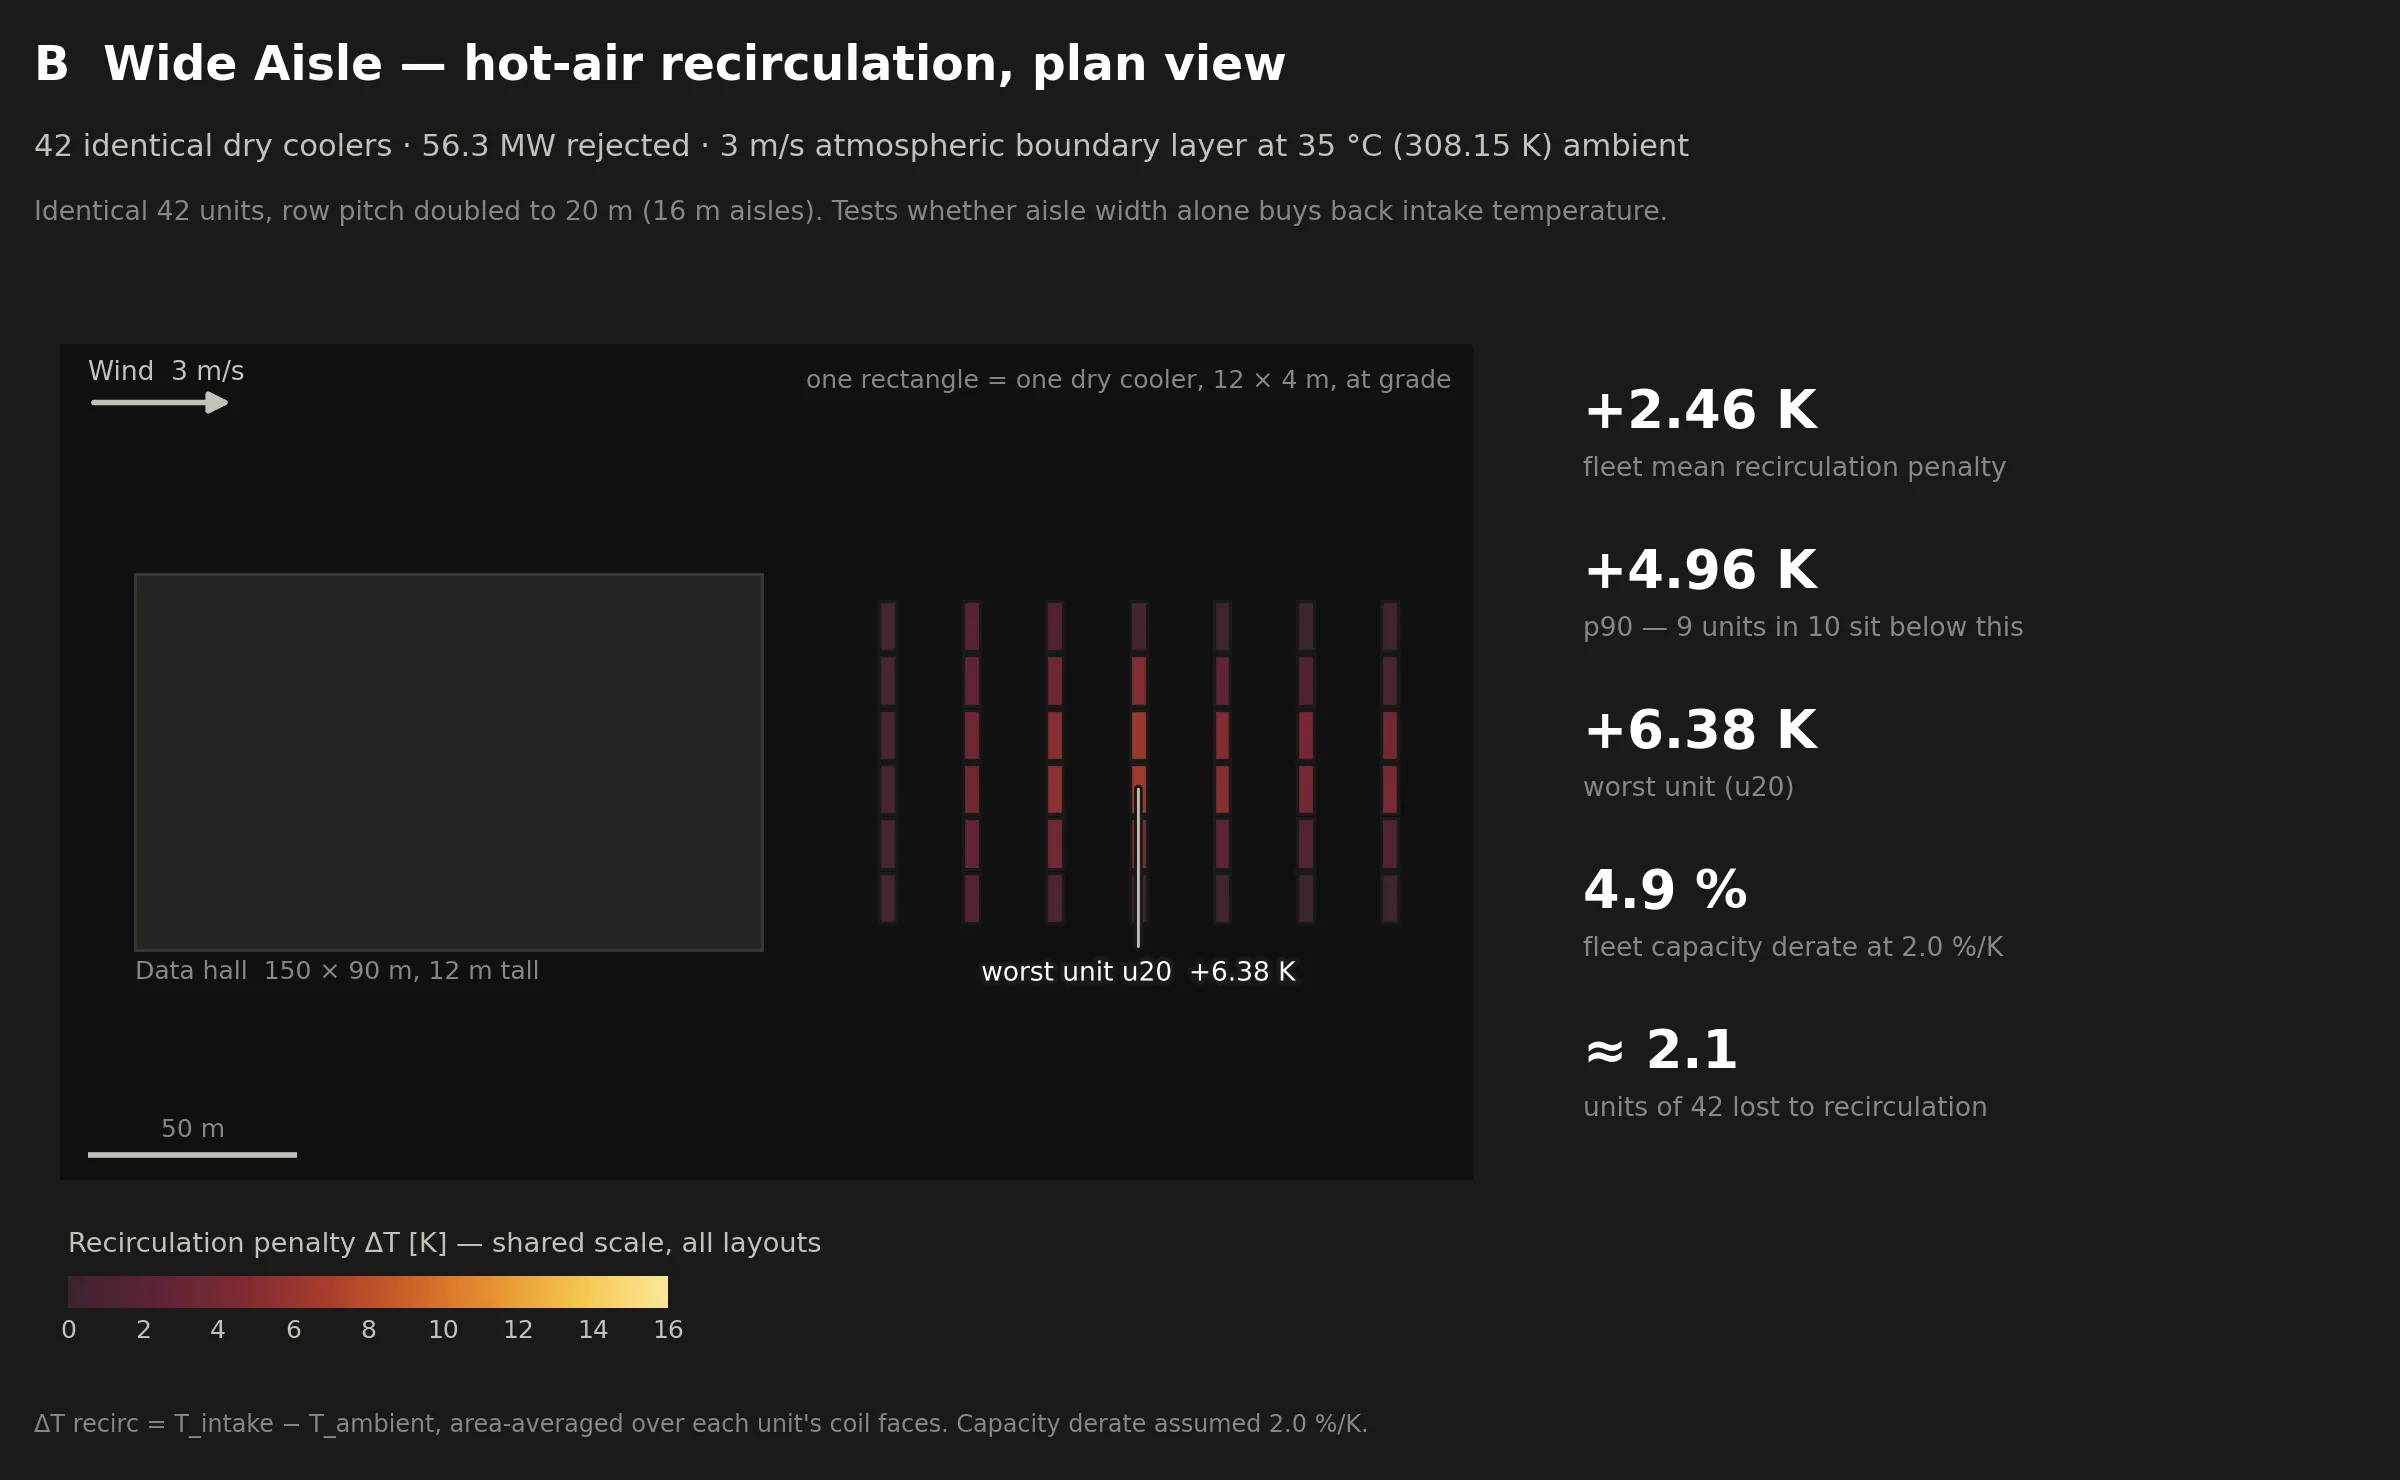
B / WIDE AISLE
The same 42 units with wider row spacing cut the fleet mean from +5.95 K to +2.46 K.
WHERE THE TIME WENT
Nine minutes of setup. Five and a half hours of physics.
The corrected sweep ran end to end in 5 h 35 m, unattended. Solving the four layouts took 5 h 26 m of that. Everything else — generating the geometry, meshing it, calibrating every unit, writing the case configs — took nine minutes.
GEOMETRY + MESH
6.5 MIN
three new layouts
UNIT CALIBRATION
<1 SEC
42 units, per case
SOLVER
5 H 26 M
four layouts
ENGINEER TOUCH TIME
0 MIN
during the sweep itself
That is the point of running this on agents. The part a traditional study spends days on — preparing geometry, building a mesh per variant, wiring up boundary conditions without letting them drift between cases — is the part that collapsed. What did not collapse is the review: an engineer still owns the physical model, the checks, and the recommendation, and that is where the day in this schedule actually goes.
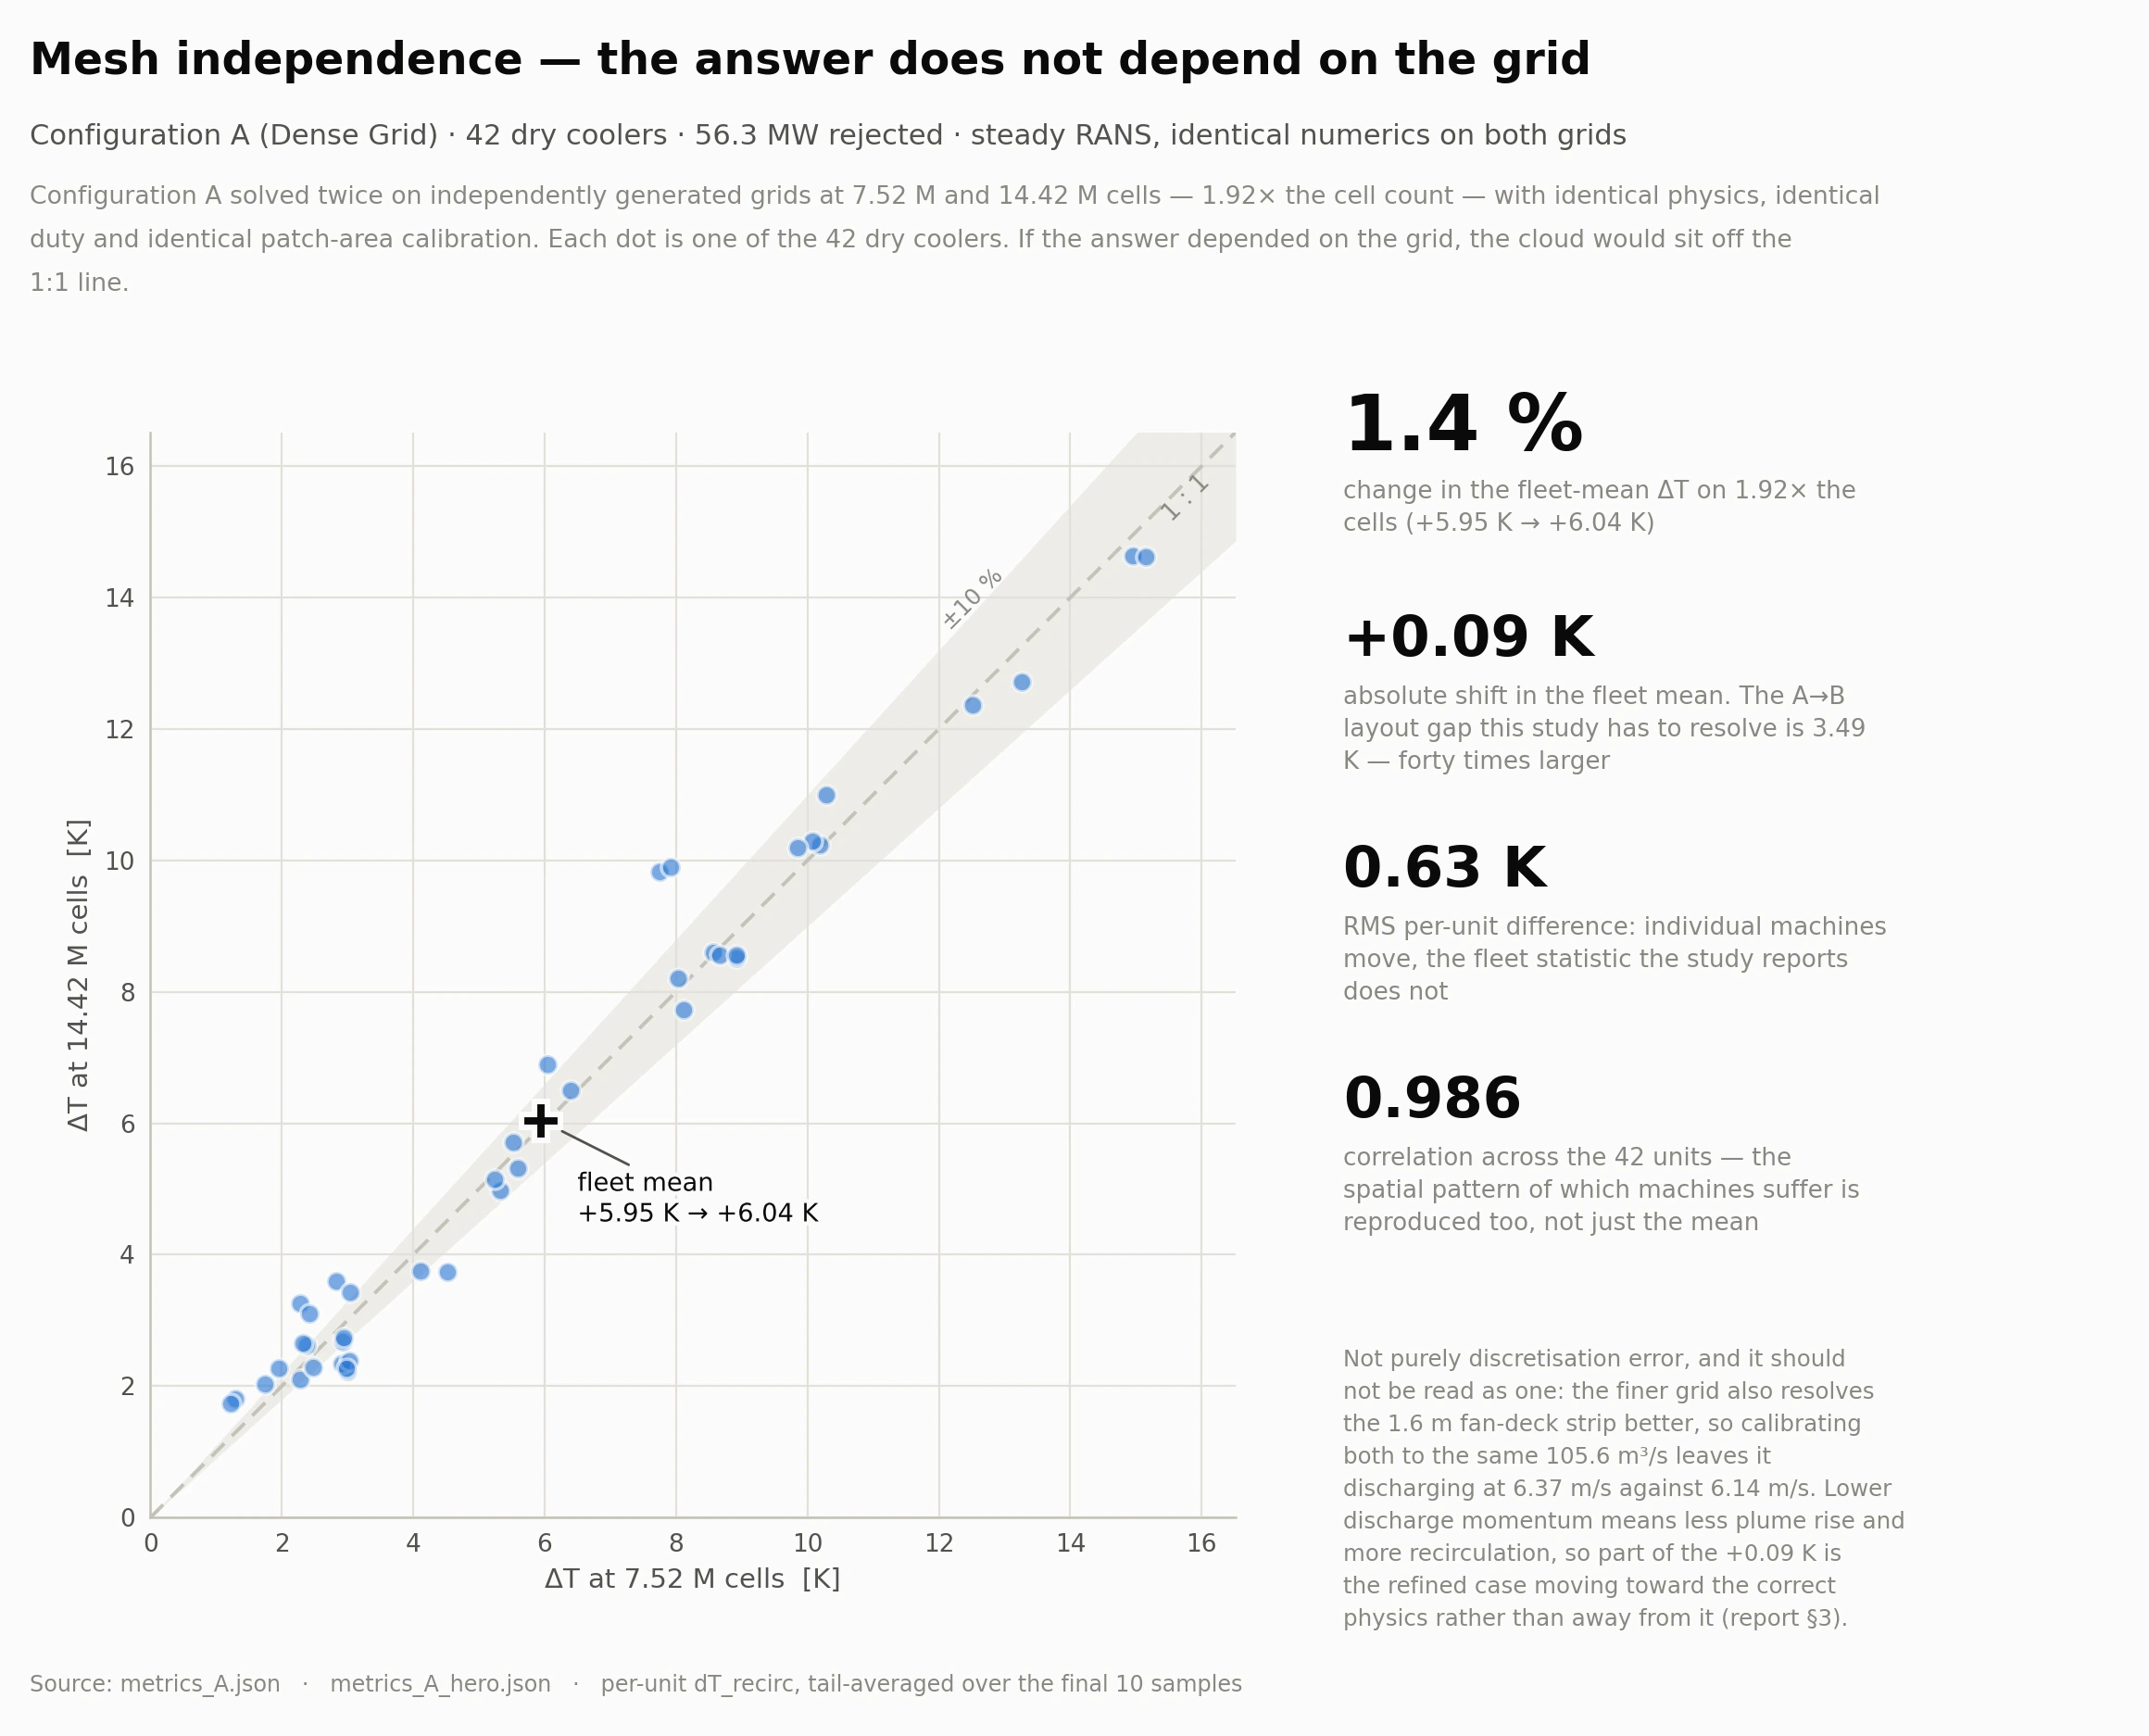
MESH SENSITIVITY
1.4%
7.5 M → 14.4 M cells
UNIT HEAT INPUT
≤0.16%
deviation from specification
JET MOMENTUM
0.05%
agreement across A, B, and D
MESH QUALITY
PASS
every case checked
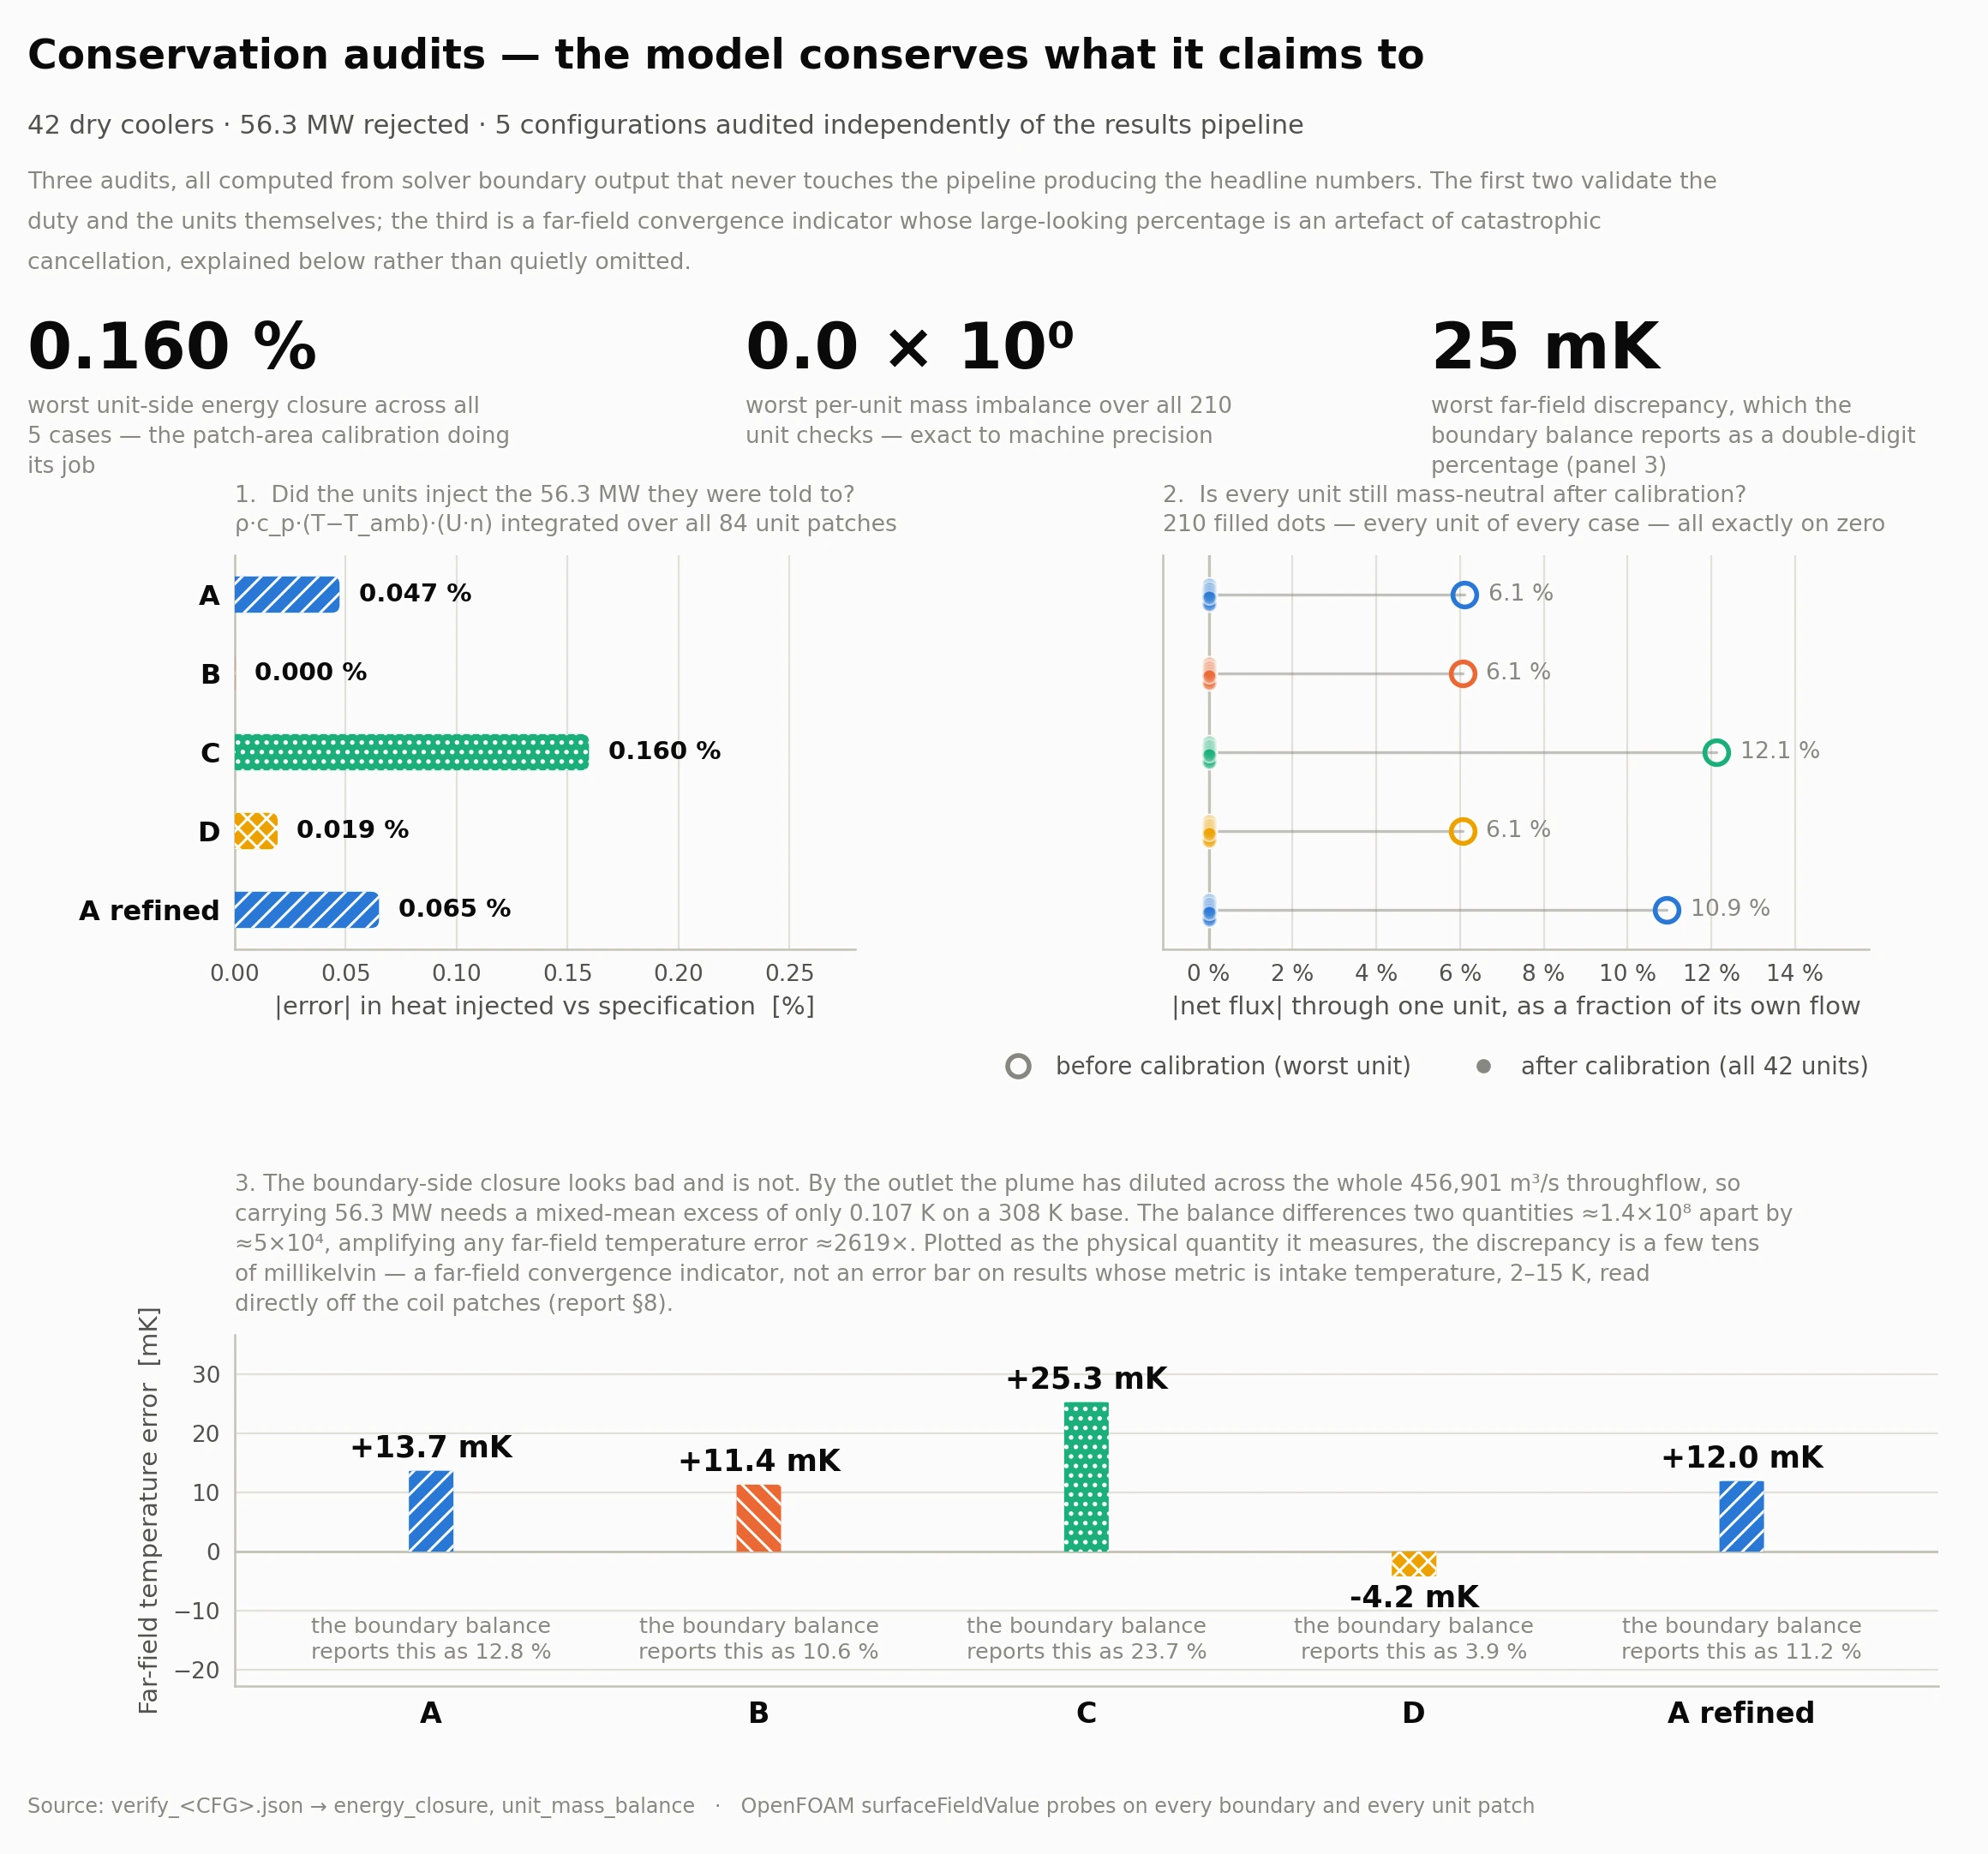
CONSERVATION AUDIT
Mass-neutral to machine precision, heat input within 0.16% of specification. The far-field balance closes to 4–24%, but that is a difference of two numbers 3000× larger — 4–19 mK of outlet temperature, with signs on both sides.
MESH SENSITIVITY
Nearly doubling the cell count moved the fleet-mean result by 0.09 K, or 1.4% — small against the 3.49 K spread between layouts.
THE RECOMMENDATION
Choose between wide aisles and split banks based on the land you actually have.
Both roughly halved the baseline penalty. Wide aisles protected the worst machine better; split banks used less paved pad and less downwind extent, but needed a wider parcel. Rooftop placement bought nothing measurable — a dead heat with the dense baseline, and its discharge momentum ran 5.2% low, so we exclude it from the conclusion.
BRING US THE DECISION
You don't need a finished brief.
Send us the geometry, operating point, and the decision you are trying to make. We will tell you what can be answered, what is missing, and the fastest defensible way to get there.
Disclosure: This is an independent study created by Navier to demonstrate our workflow. It was not performed for a customer and uses no customer data. OpenFOAM v2412, buoyantBoussinesqSimpleFoam, steady RANS with k-ω SST and ABL-consistent inlet conditions, Boussinesq buoyancy (β = 1/308.15 K⁻¹), bounded Gauss linearUpwind momentum advection, 960 × 600 × 180 m domain, constant coil duty. Results cover a single design-day condition — 35 °C ambient, 3 m/s at 10 m, wind normal to the hall's long face — not an annual weather rose. Direction sensitivity is the single most valuable extension and is not covered here. Capacity percentages apply an assumed 2% per kelvin derate, stated linear over 35–46 °C entering air; the baseline's worst unit at ≈50 °C is an extrapolation, and in practice a machine at that intake is near high-pressure trip.